This section builds on the
introduction to PerfMon, providing specific counters and prescriptive
guidance on acceptable counter thresholds. With so many counters
available, it can be difficult to know which to use when; and no single
counter is sufficient for making any decisions or recommendations.
Typically, a variety of PerfMon counters are used to construct a
picture of workload and resource consumption.
NOTE Your
aim when troubleshooting is to narrow your focus as quickly as possible
to zoom in on the problem. To do this effectively, you should use an
iterative approach, whereby each iteration has a specific objective or
component, such as disk or memory, to eliminate or incriminate. At the
end of each data-gathering cycle and log analysis (an iteration), you
should be able to say with some certainty that a particular component
of the solution has been ruled in or ruled out as the problem source.
This section looks at hardware, operating system,
and SQL Server bottlenecks, considering each major component in order
of problem likelihood: memory, disk, and CPU. You’ll also learn about
SQL Server performance counters in order to provide a plan for using
PerfMon to identify specific SQL Server problem conditions.
Bottlenecks and SQL Server
A bottleneck is any resource that
significantly restricts database performance. There will always be
bottlenecks of one kind or another — the goal is to ensure that no
single component significantly delays the entire transaction processing
system. Identifying bottlenecks enables you to prioritize your
troubleshooting; there may be numerous problems, but a clear and
specific bottleneck provides an area of focus. This section examines
some different types of bottlenecks and provides some prescriptive
guidance that can help you identify resource contention. It’s normal
for an active database server to read and write from disk lots where
locking and blocking is part of normal usage patterns; however, when
any one resource or component consumes a significant portion of query
completion time, this could cause a problem.
SQL Server performance is closely related to
server performance because query processing duration is dependent on
sufficient memory, disk, and CPU performance. SQL Server depends on
each of these resources, so they are listed in order of likelihood of
causing a problem; but each should be configured correctly and
performing well to service SQL Server and provide optimal transaction
throughput for the hardware.
Types of Bottlenecks
Most bottlenecks can be categorized as
one of two types: configuration-based or schema-based. Each of these
categories can cause bottlenecks within each resource type (CPU,
memory, and disk). Although there are many potential problem scenarios,
most server-wide or instance-wide bottlenecks tend to be
configuration-based, whereas database schema bottlenecks are database
design issues, specific to an individual database (common issues may
include schema normalization, index selection, and statistics).
Configuration-Based Bottlenecks
SQL Server doesn’t require any
specialized knowledge to install, and most of the default values are
sufficient for most deployments. When performance and scalability are
critical issues, many optimizations can be made — both to the operating
system and to SQL Server. Knowing which to change and when is key to
getting the most from the hardware and SQL Server itself .
Configuration-based bottlenecks include any
operating system configuration, such as memory settings, including /3GB
and /PAE; I/O performance tuning, such as disk sector alignment; and
HBA queue depth optimization. Additionally, there are many SQL Server
configuration-based optimizations, such as disk and log file placement,
database auto-growth settings, and any sp_configure options.
Schema-Based Bottlenecks
Schema bottlenecks are
application-specific, as they relate to the schema of a specific
database (whereas configuration bottlenecks are server-wide or
instance-wide). In most cases, the best time to optimize the schema is
during application design because schema changes have the least impact
on the application when it is still under development. Schema-based
bottlenecks illustrate why performance testing must be included as an
integral part of software build projects, as it can be incredibly
difficult to retrofit performance to an application that’s already live.
Schema-based bottlenecks include normalization
problems, whereby the schema is either overnormalized, requiring
denormalization, or not fully normalized — i.e., the tables contain
duplicate data. Additional schema-based bottlenecks include missing or
surplus indexes, missing statistics and poor choice of clustering key
(such as using a GUID instead or an incrementing identity column).
Prescriptive Guidance
This section includes details about
valuable PerfMon counters to include when troubleshooting each resource
type, and prescriptive guidance for “healthy” counter values. The
prescriptive guidance can serve as a baseline indicator of problems and
highlight any significant resource problems early in the
troubleshooting cycle, but you should also use other evidence you
gather before making a decision or recommendation to form an action
plan. As mentioned earlier, no single item of evidence is usually
enough to form a complete picture of a problem.
Each section contains a table with details about
the main PerfMon counters for each resource group, a description of
what to look for, and a value for a problem condition. Finding a
counter value that falls within the problem condition threshold
warrants further investigation.
Investigating CPU Problems
The availability of CPU cycles to
service SQL Server in a timely manner is critical to database server
performance. Configuration-based CPU bottlenecks may include max degree
of parallelism, the cost threshold of parallelism, and mis-configured
CPU hyperthreading. Changing from default configuration and the optimum
setting for each of these configuration options is scenario dependent,
it can be challenging to be presecriptive and cover all potential
scenarios — there are often edge cases and exceptions.
Kernel Mode and Application Mode
It’s important to recognize the
difference between kernel mode consumption and application mode
consumption because this concept will provide an important and useful
indicator when troubleshooting. It applies to both CPU and memory
consumption.
Kernel mode refers to internal Windows operating
system operations whereby the kernel has unrestricted access to system
hardware, such as the full memory address range, external devices, and
so on.
Application mode (also known as user mode) is
responsible for everything else, including running applications such as
SQL Server. All user-mode applications access hardware resources
through the executive, which runs in kernel mode. An application
requiring disk I/O submits the request through the kernel-mode
executive, which carries out the request and returns the results to the
requesting user-mode process.
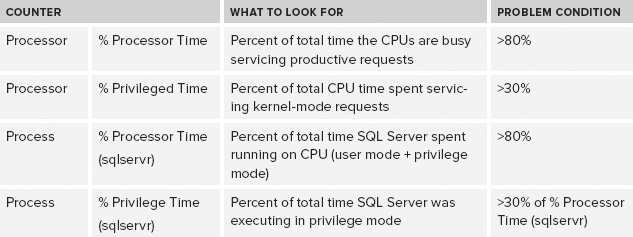
CPU Performance Counters
SQL Servers suffering from performance
problems caused by high CPU usage is a common performance issue. It can
be easy to identify the high-consumption Windows process as
sqlservr.exe using Task Manager, but the counters shown in Table 1 will provide additional information to assist in troubleshooting further.
The performance data should be captured for at
least a few minutes to ensure the sample is representative. If there is
an intermittent problem or when gathering a baseline, a longer data
capture period will result in more meaningful results.
TABLE 1: Key CPU PerfMon Counters
Common Causes of CPU Problems
This section describes three common causes of high CPU usage conditions:
- Missing Statistics or Outdated Statistics
— The Query Optimizer is dependent on relevant statistics to determine
a good execution plan. Therefore, missing or outdated statistics could
cause the Query Optimizer to select a sub-optimal plan, causing
excessive CPU consumption.
- Missing Indexes — A lack of useful
indexes can result in a high-CPU condition. SQL Server is dependent on
meaningful indexes to retrieve data efficiently, and missing indexes
often cause excessive CPU utilization. A lack of useful indexes can
result in expensive operations, such as hash joins and sorts that could
be avoided with improved indexes.
- Excessive Recompilation — Poor plan
reuse can cause a high-CPU condition whereby SQL Server consumes
excessive CPU cycles while generating query plans. Recompilations can
be caused by ad hoc or dynamic queries or by a lack of memory
(procedure cache), causing plans to be dropped from cache.
Investigating Memory-Related Problems
SQL Server performance is closely
related to the availability and performance of sufficient memory. SQL
Server configuration-related memory settings include the following:
- sp_configure
- Min/max server memory
- AWE Enabled
- Min memory per query
- Windows
- /3GB, /USERVA, /PAE (in 32-bit environments)
- Lock Pages in Memory privilege
Typically, using the Windows Task
Manager doesn’t provide the best measure of the memory consumed by SQL
Server. Using PerfMon is a more reliable method of measuring memory
consumption, since this includes all types of memory allocation that
can be made by SQL Server.
Types of Memory Pressure
SQL Server can suffer from internal or
external memory pressure, and understanding how to identify and
troubleshoot each will enable more targeted troubleshooting. External
memory pressure occurs most often when SQL Server is running on a
shared computer and several processes are competing for memory. In this
situation, Resource Monitor within SQL Server Operating System (SQLOS)
receives a signal from Windows to request that SQL Server reduce its
committed memory. This causes SQL Server to recalculate its target
commit level, and reduce it if necessary.
Internal memory pressure occurs when multiple SQL
Server resources compete with each other for memory. This typically
causes SQL Server to shrink the data cache, which can impact server
performance. Use the DBCC MEMORYSTATUS command to gain visibility of SQL Server memory consumption.
Virtual Address Space
Every Windows process has its own
virtual address space (VAS), the size of which varies according to
processor architecture (32-bit or 64-bit) and the operating system
edition. The VAS is a fixed-size resource that can be exhausted (even
on 64-bit computers) while physical memory is still available.