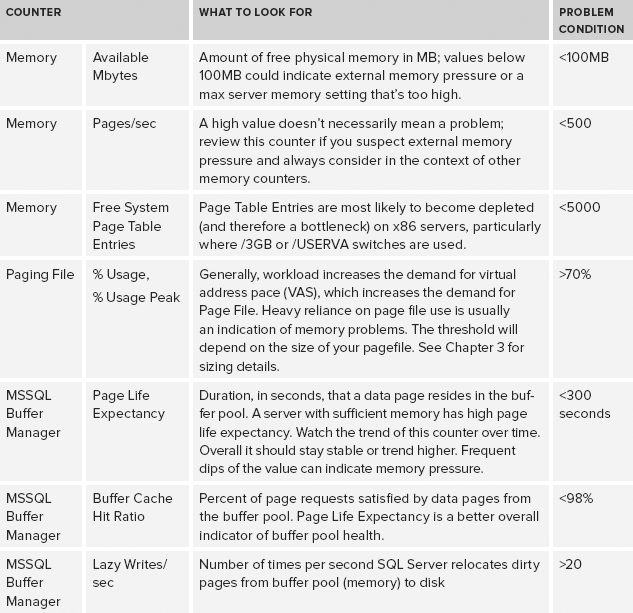
Memory Performance Counters
Table 2 outlines the PerfMon counters that are key to gathering information about memory availability and consumption.
TABLE 2: Key Memory PerfMon Counters
Disk or Storage-Related Problems
SQL Server read/write performance is
closely related to the ability of Windows to retrieve and write data
pages to disk efficiently. Efficient and timely data access is
dependent on both configuration-based and schema-based factors, such as
data and log file sizing and placement, useful indexes, and index
fragmentation.
Disk and storage performance can be a hugely
complex and protracted exercise, and one that is often confused by
unclear terminology and logical abstractions that make it hard to
identify root cause. However, regardless of storage hardware, disk
layout, or path configuration, the only aspect of real interest is the
time required to read or write from disk because this is a great
indicator of whether disk access performance is likely to cause SQL
Server problems.
Typically, once disk access has been identified
as a bottleneck, tools more specialized than PerfMon must be employed
to provide a lower level of detail on bottlenecks. Most SAN vendors
provide performance-monitoring tools that help diagnose issues with
storage controllers, cache performance, and physical disk service time.
These tools provide further diagnosis on the over-utilized component
and performance bottleneck.
Disk performance problems have wide and varied
potential resolutions, including extensive disk reconfiguration, such
as changing RAID level, disk group membership, and strip size. You can
also make many enhancements within SQL Server, including right-sizing
data and log files; pre-allocating space; and, for very large
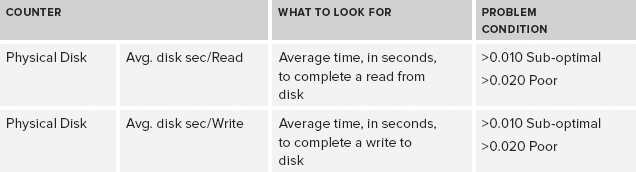
databases, table partitioning. Table 3 describes the main PerfMon counters to check for disk performance.
TABLE 3: Key Disk PerfMon Counters
SQL Server Performance Problems
Sometimes server hardware resources do
not cause bottlenecks, but application performance is still bad. In
this situation, it’s possible that internal SQL Server resources can
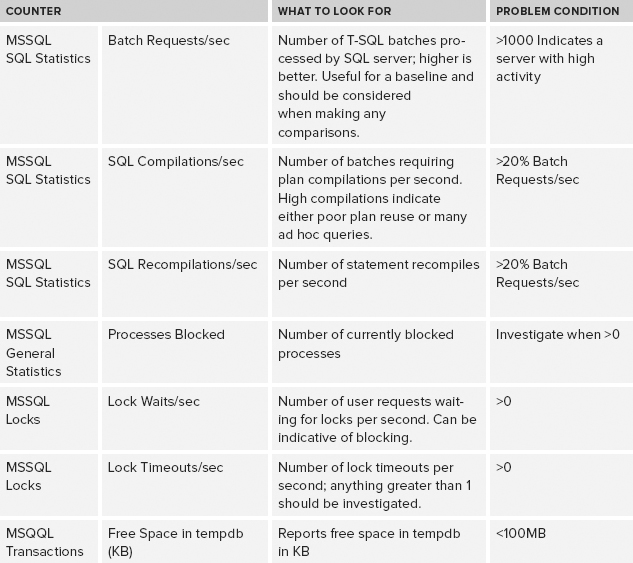
become exhausted or depleted. Table 4 describes the principal counters for monitoring internal SQL Server resources.
TABLE 4: Key SQL Server PerfMon Counters
Wait Stats Analysis
SQL Server wait stats record the amount
of time SQL Server spends waiting for each resource. A number of these
wait types are exposed as PerfMon counters:
- Lock waits
- Log write waits
- Network I/O waits
- Non-page latch waits
- Page I/O latch waits
- Page latch waits
- Waits for the worker
Although it may be easier to access
these wait stats from the DMVs within SQL Server, collecting them as
part of a system-wide data-gathering exercise with PerfMon minimizes
the logistics effort involved in collecting the information.
Getting a Performance Baseline
A performance baseline is simply a
PerfMon log from a time frame representing “normal” performance,
retained for future review. The PerfMon log should contain counters
that build a complete picture of hardware and SQL Server resources
during a representative workload period.
The performance baseline can provide answers to
questions that an individual would otherwise be unable to answer. On
occasions when there are any performance problems, the baseline is
available for comparison; and by mapping the SQL Server batch requests
per second against other values, it will be possible to identify and
compare problem server activity per workload with the workload of a
known good data capture.
The baseline should be continually
maintained; otherwise, configuration changes or tuning optimizations
could alter the output and invalidate any comparison. It’s useful to
get into the habit of taking a fresh baseline on a regular basis.