3. Monitoring Administration
This section reviews common administration
tasks for the Lync Server 2013 Monitoring role. In general, there isn’t
much day-to-day administration of the Lync Server 2013 Monitoring
components. Instead, this section focuses on the reports generated by
the Monitoring Server.
The most important page is the Dashboard. The
Dashboard is broken up into four distinct areas or panes: System Usage,
Per-User Call Diagnostics, Call Reliability Diagnostics, and Media
Quality Diagnostics. By default, the Dashboard shows “this week” and a
“6 week” view. However, a monthly view is also available via a link in
the upper-right corner of the screen.
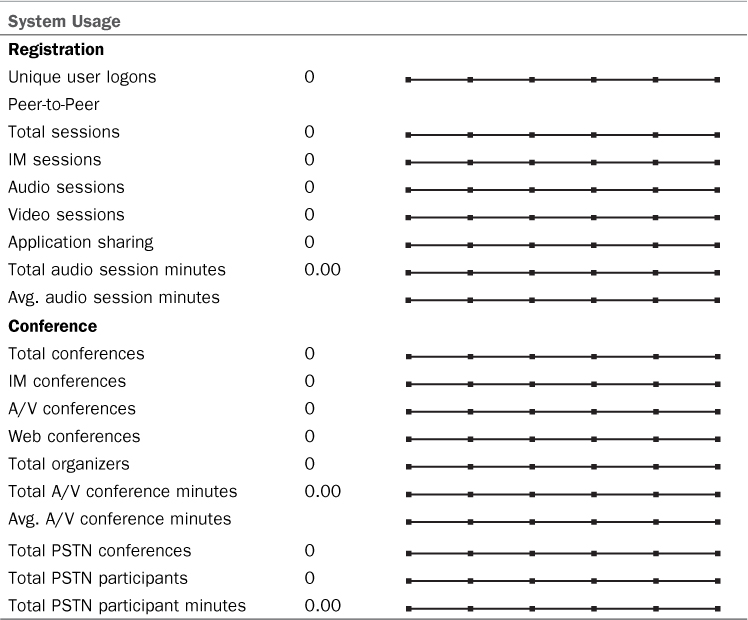
System Usage is the first section (see Table 1).
Many of the fields are self-explanatory, and they are very useful for
at-a-glance looks at the environment. For example, the total A/V
Conference Minutes item is great for “back of the napkin” ROI on the
savings Lync Server 2013 provides over outsourced conferencing
services. Possibly even more important, it gives a snapshot of how your
users are using Lync Server. Are they using Communicator as a
softphone? How about for application sharing? Has overall collaboration
time increased since Lync Server 2013 was implemented? This report
isn’t the end-all for these answers but it does provide an insightful
view.
Table 1. The System Usage Section of the Dashboard

The next section is Per-User Call Diagnostics (see Table 2).
This is a great at-a-glance view for overall health of your voice
deployment. It also makes for great bragging rights in a well-planned
deployment.
Table 2. Per-User Call Diagnostics Section of the Dashboard

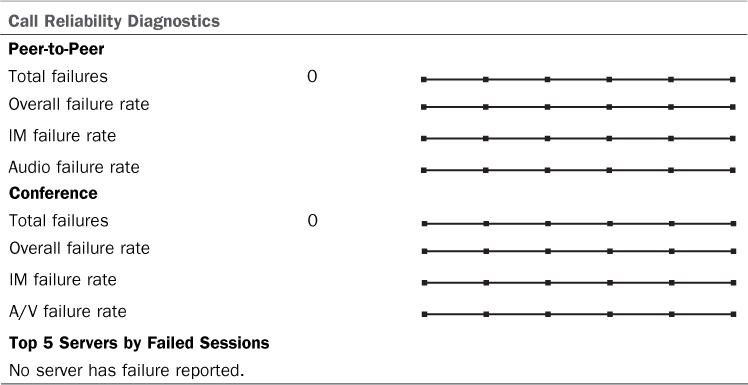
The Call Reliability Diagnostics section (see Table 3)
provides a deeper view into the health of your UC deployment and a
window into the end-user experience. This is something new to Lync
Server 2013 and is a very valuable resource to administrators.
Table 3. Call Reliability Diagnostics Section of the Dashboard

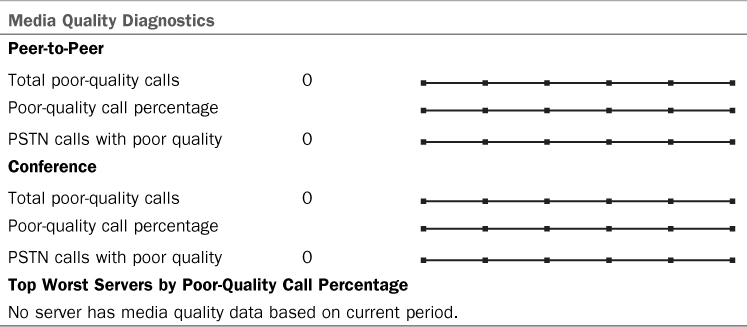
The last section is Media Quality Diagnostics (see Table 4).
This table gives information about quality of calls in terms of total
poor-quality calls and percentage of poor-quality calls compared to the
total number of calls. It also offers the same metrics for conferences.
Table 4. Media Quality Diagnostics Section of the Dashboard

From the main Monitoring Server reports page
there are a plethora of reports to review. The next section summarizes
each report in the order in which it is presented on the main page.
Also, here is a full list of the available reports. You’ll see that
they are a deeper dive into the snapshots presented in the Monitoring
Server reporting Dashboard.
• System Usage Reports
• User Registration Report
• Peer-to-Peer Activity Summary Report
• Conference Summary Report
• PSTN Conference Summary Report
• Response Group Service Usage Report
• IP Phone Inventory Report
• Per-User Diagnostics Reports
• User Activity Report
• Call Reliability Diagnostics Reports
• Call Reliability Summary Report
• Peer-to-Peer Activity Reliability Report
• Conference Reliability Report
• Top Failures Report
• Failure Distribution Report
• Media Quality Diagnostics Reports
• Media Quality Summary Report
• Server Performance Report
• Location Report
• Device Report
• User Registration Report—This report
shows user registrations over time. This can be useful to determine
peak login times and AD authentication requirements.
• Peer-to-Peer Activity Summary
Report—This report shows peer-to-peer activity including IMs,
application sharing, and file transfers.
• Conference Summary Report—The
Conference Summary Report measures conference metrics including
Communicator conferences and PSTN conferences, number of organizers,
and total conference minutes.
• PSTN Conference Summary Report—This report contains data specific to PSTN Conferences in Lync Server.
• Response Group Service Usage
Report—Metrics for Response Groups including agent response and number
of calls answered by the response group.
• IP Phone Inventory Report—Statistics
about the number and type of IP phones in the Lync Server deployment.
Includes all Communicator Phone Edition devices.
• User Activity Report—This report
reviews user-focused call failures for person-to-person calls and
conferences. This report is useful for measuring the overall health of
your conferencing deployment.
• Call Reliability Summary Report—This gives a high-level view of failed calls, total call minutes, and other call metrics.
• Peer-to-Peer
Activity Reliability Report—This report contains information about
failures in peer-to-peer activity including IMs and collaboration
activity.
• Conference Reliability Report—This reports on failures during IM, peer-to-peer, and PSTN conferences.
• Top Failures Report—This report gives
a snapshot view of the top failures in the organization. It can reveal
systemic problems and configuration issues.
• Failure Distribution Report—This
report provides statistics about the failures related to site or pool.
It is a great troubleshooting tool for finding error conditions.
• Media Quality Summary Report—This
report provides an overall high-level view of media quality across the
whole environment. It should be referenced often to review the overall
health of your voice deployment.
• Server Performance Report—This report
breaks down media quality metrics by server. This is especially
important in deployments that utilize separate mediation servers.
• Location Report—The Location Report
reviews media quality statistics by location defined in Lync Server or
by individual users.
• Device Report—Similar to the Location
Report, the Device Report pivots media quality data by type of device
used when a failure is experienced.
Although some of the reports might
initially seem similar, they all examine the data from a different,
unique angle. These reports are critical in proactively monitoring the
health of your Lync Server environment. A wise administrator will
leverage these reports along with a monitoring platform like Microsoft
System Center Operations Manager.
4. Monitoring Troubleshooting
The Monitoring role is fairly
straightforward; however, there are a few things that commonly go wrong
during deployment. This section covers the common issues and areas to
check should you find your Monitoring Server deployment not going
smoothly.
Because a lot of server-to-server connections
are involved in a Monitoring Server deployment, the most obvious
problem area is in ensuring proper permissions. Also, ensure that
usernames and passwords are typed correctly. When in doubt, reenter the
usernames and passwords used for database access for the Monitoring
Server and the Reporting Server. Also, ensure that the accounts aren’t
subject to password expiration in Active Directory. There’s no “doh”
feeling like having a service account’s password expire 30 or 90 days
into your deployment.
If you’ve chosen to use SSL for your
Reporting Services URLs, ensure that the subject name (SN) of the
certificate matches the site name you’ve chosen. Note that this might
or might not be the same as the FQDN of your server, depending on your
reporting server configuration.
The Lync Server
event log is also a good place to check for errors. From the Start menu
select Administrative Tools and then Event Viewer. Expand the
Applications and Services Logs item and select Lync Server. All events
related to Lync Server functions reside here. Often the error
description is enough to identify the problem and determine the
resolution.
5. Archiving Components Installation
The only component needed for Lync
Server 2013 Archiving, outside of choosing to add it to all the Front
End Servers during the Topology building process, is installation of
SQL Server. SQL Server 2008 R2 and SQL Server 2012 are supported for
Lync 2013.