The DSS/BI examples start with a traditional star
schema data warehouse deployment for a Silicon Valley high-tech company.
The same data has also been deployed as an OLAP cube created by
Analysis Services.
The last example, describes a
hybrid distributed reporting system that, uses multiple SQL Server
technologies such as data replication, database mirroring, and database
snapshots to get the most out of a complex healthcare industry
application environment.
DSS Example One
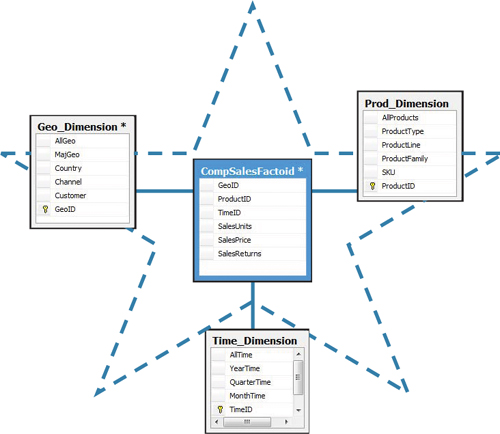
A Silicon Valley
computer company implemented a traditional data warehouse using a star
schema approach. A star schema provides multiple paths (dimensions) to
the central data facts. As you can see in Figure 1,
a decision support user can get to the Sales Units, Sales Price, and
Sales Returns through Geographic, Time, and Product dimensions. This
allows the user to ask questions such as “What were net sales for North
America for a particular month for a specific computer product?” SQL
Server Integration Services (SSIS) packages populate this data warehouse
and conformed dimensions on a daily basis with deltas (new data changes
only). The data warehouse is unavailable for about one hour each night
as daily updates are rolled into this deployment.
This
SQL Server instance is isolated from the OLTP application where the
data is sourced. There are about 500–600 data warehouse users of this
data globally. This data warehouse is approaching 5TB in size.
DSS Example Two
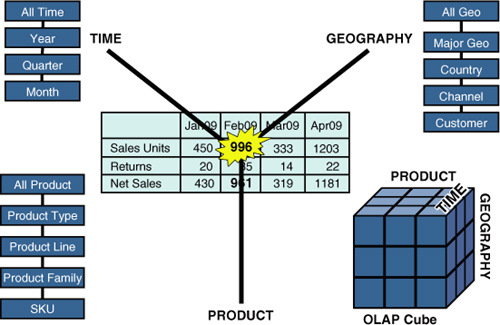
The same Silicon
Valley computer company also implemented some of the same data in a more
complex Analysis Services OLAP cube for data mining purposes. The
company had many things it did not know about its sales data and wanted
to do complex trending and forecasting to better understand the demand
for products worldwide. Figure 2
shows the OLAP cube built in Analysis Services for this complex
business intelligence purpose. Several demand forecasting and product
sales trending models were developed to allow this company to predict
sales by each of its products for each geographic region.
DSS Example Three
This
last example features a multitechnology hybrid data reporting solution
that provides real-time reporting along with point-in-time reporting for
a major healthcare organization in the Pacific Northwest. This solution
starts with real-time data replication from its online transactional
systems where all hospital transactions are taking place. This includes
patient events, medications administered, surgeries done, hospital
charges, and so on. By distributing this data to a highly available
two-node SQL Cluster, the hospital is able to realize all its real-time
reporting requirements that center around providing all known
information for a particular patient in the hospital at any time. Figure 3
shows this OLTP-to-SQL cluster real-time, continuous data replication
and the real-time reporting enabled by this data distribution.
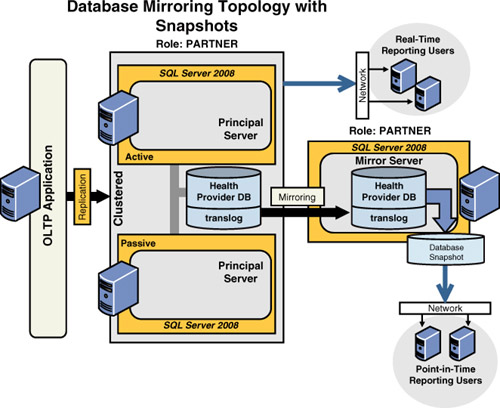
Another
major reporting requirement for this health organization is not a
real-time requirement, but rather a leisurely hourly snapshot,
point-in-time reporting requirement. A much larger group of users must
be served by this noncritical reporting need and cannot impact the
real-time reporting environment in any way. To satisfy this
point-in-time, noncritical reporting need, the health organization
leveraged SQL Server database mirroring from the replicated SQL Server
Health Provider DB. From the mirror, hourly database snapshots are
created to satisfy all the point-in-time reporting needs of the
organization. This configuration has been extremely stable since the SQL
Server 2005 deployment.