2.4 Deadlocks
A deadlock occurs
when two processes are each waiting for a locked resource that the other
process currently holds. Neither process can move forward until it
receives the requested lock on the resource, and neither process can
release the lock it is currently holding until it can receive the
requested lock. Essentially, neither process can move forward until the
other one completes, and neither one can complete until it can move
forward.
Two primary types of deadlocks can occur in SQL Server:
Cycle deadlocks—
A cycle deadlock occurs when two processes acquire locks on different
resources, and then each needs to acquire a lock on the resource that
the other process has. Figure 3 demonstrates an example of a cycle deadlock.
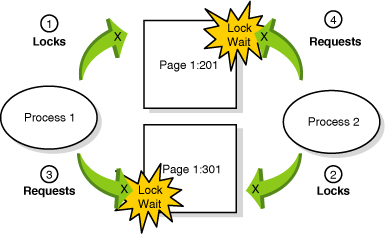
In Figure 37.11,
Process 1 acquires an exclusive lock on page 1:201 in a transaction. At
the same time, Process 2 acquires an exclusive lock on page 1:301 in a
transaction. Process
1 then attempts to acquire a lock on page 1:301 and begins waiting for
the lock to become available. Simultaneously, Process 2 requests an
exclusive lock on page 1:201, and a deadlock, or “deadly embrace,”
occurs.
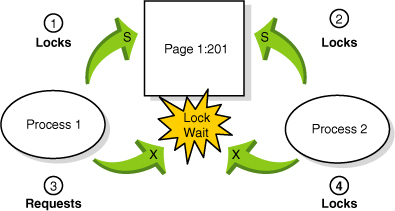
Conversion deadlocks—
A conversion deadlock occurs when two or more processes each hold a
shared lock on the same resource within a transaction and each wants to
promote the shared lock to an exclusive lock, but neither can do so
until the other releases the shared lock. An example of a conversion
deadlock is shown in Figure 4.
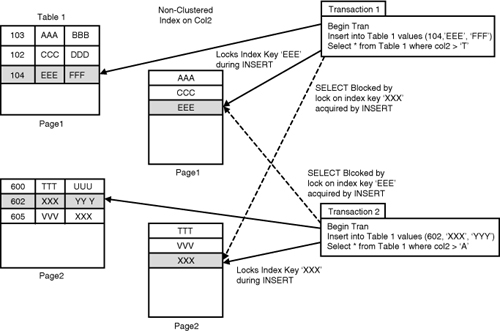
It is often assumed that deadlocks happen at the data
page or data row level. In fact, deadlocks often occur at the index
page or index key level. Figure 5 depicts a scenario in which a deadlock occurs due to contention at the index key level.
SQL Server automatically detects when a deadlock situation occurs. A separate process in SQL Server, called LOCK_MONITOR,
checks the system for deadlocks roughly every 5 seconds. In the first
pass, this process detects all the processes that are waiting on a lock
resource. The LOCK_MONITOR thread checks for deadlocks by
examining the list of waiting lock requests to see if any circular lock
requests exist between the processes holding locks and the processes
waiting for locks. When the LOCK_MONITOR detects a deadlock,
SQL Server aborts the transaction of one of the involved processes. How
does SQL Server determine which process to abort? It attempts to choose
as the deadlock victim the transaction that it estimates would be least
expensive to roll back. If both processes involved in the deadlock have
the same rollback cost and the same deadlock priority, the deadlock
victim is chosen randomly.
Note
As
deadlocks occur, SQL Server begins reducing the deadlock detection
interval and can potentially go as low as 100ms. In addition, the first
few lock requests that cannot be satisfied after a deadlock is detected
immediately trigger a deadlock search instead of waiting for the next
deadlock detection interval. When deadlock frequency declines, the
deadlock detection interval begins to increase back to 5 seconds.
You can influence which process will be the deadlock victim by using the >SET DEADLOCK_PRIORITY statement. DEADLOCK_PRIORITY can be set to LOW, NORMAL, or HIGH. Alternatively, DEADLOCK_PRIORITY can also be set to any integer value from -10 to 10. The default deadlock priority is NORMAL.
When two sessions deadlock, and the deadlock priority has been set to
something other than the default, the session with the lower priority is
chosen as the deadlock victim. If you have lower-priority processes
that you would prefer always be chosen as the deadlock victims, you
might want to set the process’s deadlock priority to LOW. Alternatively, for critical processes, you might want to set the deadlock priority to HIGH to specify processes that should always come out as the winners in a deadlock scenario.
Avoiding Deadlocks
Although SQL Server automatically detects and handles
deadlocks, you should try to avoid deadlocks in your applications. When
a process is chosen as a deadlock victim, it has to resubmit
its work because it has been rolled back. Frequent deadlocks create
performance problems if you have to keep repeating work.
You can follow a number of guidelines to minimize, if
not completely eliminate, the number of deadlocks that occur in your
application(s). Following the guidelines presented earlier to minimize
locking contention and speed up your transactions also helps to
eliminate deadlocks. The less time for which a transaction is holding
locks, the less likely the transition will be around long enough for a
conflicting lock request to be requested at the same time. In addition,
you might want to follow this list of additional guidelines when
designing applications:
Be consistent about the order in which you access the data from tables to avoid cycle deadlocks.
Minimize the use of HOLDLOCK
or queries that are running using Repeatable Read or Serializable Read
isolation levels. This helps avoid conversion deadlocks. If possible,
perform UPDATE statements before SELECT statements so
that your transaction acquires an update or exclusive lock first. This
eliminates the possibility of a conversion deadlock.
Choose the transaction isolation level judiciously. You might be able to reduce deadlocks by choosing lower isolation levels.
Handling and Examining Deadlocks
SQL Server returns error number 1205 to the client
when it aborts a transaction as a result of deadlock. The following is
an example of a 1205 error message:
Msg 1205, Level 13, State 51, Line 1
Transaction (Process ID 53) was deadlocked on lock resources with another process
 and has been chosen as the deadlock victim. Rerun the transaction.
Because a deadlock is not a logical error but merely a
resource contention issue, the client can resubmit the entire
transaction. To handle deadlocks in applications, be sure to trap for
message 1205 in the error handler. When a 1205 error occurs, the
application can simply resubmit the transaction automatically. It is
considered bad form to allow end users of an application to see the
deadlock error message returned from SQL Server.
You learned how to use sp_who2 and the sys.dm_tran_locks and sys.dm_os_waiting_tasks
system catalog views to monitor locking contention between processes.
However, when a deadlock occurs, one transaction is rolled back, and one
is allowed to continue. If you examine the output from sp_who2
or the system catalog views after a deadlock occurs, the information
likely will not be useful because the locks on the resources involved
will have since been released.
Fortunately, SQL Server provides a couple of trace
flags to monitor deadlocks within SQL Server. They are trace flag 1204
and trace flag 1222. When enabled, they print deadlock information to
the SQL Server error log. Trace flag 1204 provides deadlock information generated
by each process involved in the deadlock. Trace flag 1222 provides
deadlock information by processes and by resources. Both trace flags can
be enabled to capture a complete representation of a deadlock event.
You use the DBCC TRACEON command to turn on the trace flags and DBCC TRACEOFF
to turn them off. The 1204 and 1222 trace flags are global trace flags.
Global trace flags are set at the server level and are visible to every
connection on the server. They cannot be set for a specific session
only. They enable or disable a global trace flag, and the -1 option must be specified as the second argument to the DBCC TRACEON and DBCC TRACEOFF commands. The following example shows how to globally enable the 1204 trace flag:
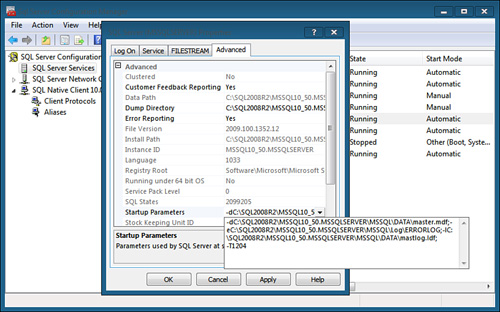
If possible, it is best to set global trace flags whenever SQL Server is started up by adding the -T
option with the appropriate trace flag value to the SQL Server startup
parameters. For example, to have SQL Server turn on the 1204 trace flag
automatically on startup, you use the SQL Server Configuration Manager.
In the SQL Server Configuration Manager window, you click SQL Server
2005 Services; in the right pane, right-click the SQL Server service for
the appropriate SQL Server instance name and then click Properties. On
the Advanced tab, expand the Startup Parameters box and type a semicolon
(;) and -T1204 after the last startup parameter listed (see Figure 6); then click OK to save the changes. You then need to stop and restart SQL Server for the trace flag to take effect.
Caution
The 1204 and 1222 trace flags may incur some
additional processing overhead in SQL Server. They should be used only
when you are debugging and tuning SQL Server performance, and they
should not be left on indefinitely in a production environment. You
should turn them off after you have diagnosed and fixed the problems.
The 1204 Trace Flag
Trace flag 1204 prints useful information to the SQL
Server error log when a deadlock is detected. The following output is
from the error log for this trace flag:
2010-02-14 18:44:36.27 spid6s     Deadlock encountered .... Printing deadlock
 information
2010-02-14 18:44:36.27 spid6s     Wait-for graph
2010-02-14 18:44:36.27 spid6s
2010-02-14 18:44:36.27 spid6s     Node:1

2010-02-14 18:44:36.33 spid6s     KEY: 8:391941215944704 (59d1a826552c) CleanCnt:3
 Mode:S Flags: 0x1
2010-02-14 18:44:36.33 spid6s      Grant List 0:
2010-02-14 18:44:36.33 spid6s        Owner:0x0FE274C0 Mode: S       Flg:0x40
 Ref:0 Life:02000000 SPID:53 ECID:0XactLockInfo: 0x05626F00
2010-02-14 18:44:36.33 spid6s        SPID: 53 ECID: 0 Statement Type: DELETE
 Line #: 1
2010-02-14 18:44:36.33 spid6s        Input Buf: Language Event: delete
 bigpubs2008..stores
where stor_id = '7066'
2010-02-14 18:44:36.33 spid6s     Requested by:
2010-02-14 18:44:36.33 spid6s       ResType:LockOwner Stype:'OR'Xdes:0x06136280
 Mode: X SPID:57 BatchID:0 ECID:0 TaskProxy:(0x062DE354) Value:0xfe27580 Cost:(0/0)
2010-02-14 18:44:36.33 spid6s
2010-02-14 18:44:36.33 spid6s     Node:2

2010-02-14 18:44:36.33 spid6s     KEY: 8:391941215944704 (59d1a826552c)
 CleanCnt:3 Mode:S Flags: 0x1
2010-02-14 18:44:36.33 spid6s      Grant List 0:
2010-02-14 18:44:36.33 spid6s        Owner:0x0FE27480 Mode: S
Flg:0x40 Ref:0 Life:02000000 SPID:57 ECID:0 XactLockInfo: 0x061362A8
2010-02-14 18:44:36.33 spid6s        SPID: 57 ECID: 0 Statement Type: DELETE
 Line #: 1
2010-02-14 18:44:36.33 spid6s        Input Buf: Language Event: delete
 bigpubs2008..stores
where stor_id = '7066'
2010-02-14 18:44:36.33 spid6s     Requested by:
2010-02-14 18:44:36.33 spid6s       ResType:LockOwner Stype:'OR'Xdes:0x05626ED8
 Mode: X SPID:53 BatchID:0 ECID:0 TaskProxy:(0x06892354) Value:0xfe27240 Cost:(0/0)
2010-02-14 18:44:36.33 spid6s
2010-02-14 18:44:36.33 spid6s     Victim Resource Owner:
2010-02-14 18:44:36.33 spid6s      ResType:LockOwner Stype:'OR'Xdes:0x06136280

 Mode: X SPID:57 BatchID:0 ECID:0 TaskProxy:(0x062DE354) Value:0xfe27580 Cost:(0/0)
Although
the 1204 output is somewhat cryptic, it is not too difficult to read if
you know what to look for. If you look through the output, you can see
where it lists the SPIDs of the processes involved in the deadlock (in
this example, SPIDs 53 and 57) and indicates which process was chosen as
the deadlock victim (SPID:57). The type of statement involved is indicated by Statement Type. In this example, both processes were attempting a DELETE statement. You can also examine the actual text of the query (Input Buf)
that each process was executing at the time the deadlock occurred. The
output also displays the locks granted to each process (Grant List), the lock types (Mode:) of the locks held, and the lock resources requested by the deadlock victim.
The 1222 Trace Flag
Trace flag 1222 provides deadlock information, first
by processes and then by resources. The information is returned in an
XML-like format that does not conform to an XML schema definition. The
output has three major sections:
The first section declares the deadlock victim.
The second section describes each process involved in the deadlock
The third section describes the resources involved
The following example shows the 1222 trace flag
output for the same deadlock scenario displayed by the 1204 trace flag
output in the previous section:
2010-02-14 18:50:38.95 spid19s    deadlock-list
2010-02-14 18:50:38.95 spid19s     deadlock victim=process2e4be40
2010-02-14 18:50:38.95 spid19s      process-list
2010-02-14 18:50:38.95 spid19s       process id=process2e4be40 taskpriority=0
 logused=0 waitresource=KEY: 8:391941215944704 (59d1a826552c) waittime=4719
 ownerId=3060410 transactionname=user_transaction lasttranstarted=
 2010-02-14T18:50:19.863 XDES=0x5626ed8 lockMode=X schedulerid=1 kpid=
 8316 status=suspended spid=57 sbid=0 ecid=0 priority=0 trancount=2
 lastbatchstarted=2010-02-14T18:50:34.170 lastbatchcompleted=
 2010-02-14T18:50:19.867 lastattention=2010-02-14T18:40:55.483 clientapp=
 Microsoft SQL Server Management Studio - Query hostname=LATITUDED830-W7
 hostpid=940 loginname=LATITUDED830-W7\rrankins isolationlevel=serializable
 (4) xactid=3060410 currentdb=8 lockTimeout=4294967295 clientoption1=671090784
 clientoption2=390200
2010-02-14 18:50:38.95 spid19s        executionStack
2010-02-14 18:50:38.95 spid19s         frame procname=adhoc line=1 stmtstart=36
 sqlhandle=0x0200000091375f0a4f39d6bfb1addf384048ee0fa211d85f
2010-02-14 18:50:38.95 spid19s     DELETE [bigpubs2008]..[stores] WHERE
 [stor_id]=@1
2010-02-14 18:50:38.95 spid19s          frame procname=adhoc line=1
 sqlhandle=0x02000000748e4d288370bb86daf8048c94f6402aeacee742
2010-02-14 18:50:38.95 spid19s     delete bigpubs2008..stores
2010-02-14 18:50:38.95 spid19s     where stor_id = '7066'
2010-02-14 18:50:38.95 spid19s         inputbuf
2010-02-14 18:50:38.95 spid19s     delete bigpubs2008..stores
2010-02-14 18:50:38.95 spid19s     where stor_id = '7066'
2010-02-14 18:50:38.95 spid19s        process id=process2e4b390 taskpriority=0
 logused=0 waitresource=KEY: 8:391941215944704 (59d1a826552c) waittime=9472
 ownerId=3060605 transactionname=user_transaction lasttranstarted=
 2010-02-14T18:50:24.447 XDES=0x6136280 lockMode=X schedulerid=1 kpid=7384
 status=suspended spid=53 sbid=0 ecid=0 priority=0 trancount=2
 lastbatchstarted=2010-02-14T18:50:29.413 lastbatchcompleted=
 2010-02-14T18:50:24.447 clientapp=Microsoft SQL Server Management Studio -
 Query hostname=LATITUDED830-W7 hostpid=940 loginname=LATITUDED830-W7\rrankins
 isolationlevel=serializable (4) xactid=3060605 currentdb=8 lockTimeout=4294967295
 clientoption1=671090784 clientoption2=390200
2010-02-14 18:50:38.95 spid19s         executionStack
2010-02-14 18:50:38.95 spid19s          frame procname=adhoc line=1 stmtstart=36
 sqlhandle=0x0200000091375f0a4f39d6bfb1addf384048ee0fa211d85f
2010-02-14 18:50:38.95 spid19s     DELETE [bigpubs2008]..[stores] WHERE
 [stor_id]=@1
2010-02-14 18:50:38.95 spid19s         frame procname=adhoc line=1
 sqlhandle=0x02000000748e4d288370bb86daf8048c94f6402aeacee742
2010-02-14 18:50:38.95 spid19s     delete bigpubs2008..stores
2010-02-14 18:50:38.95 spid19s     where stor_id = '7066'
2010-02-14 18:50:38.95 spid19s        inputbuf
2010-02-14 18:50:38.95 spid19s     delete bigpubs2008..stores
2010-02-14 18:50:38.95 spid19s     where stor_id = '7066'
2010-02-14 18:50:38.95 spid19s       resource-list
2010-02-14 18:50:38.95 spid19s        keylock hobtid=391941215944704 dbid=8
 objectname=bigpubs2008.dbo.stores indexname=UPK_storeid id=lockfd432c0 mode=S
 associatedObjectId=391941215944704
2010-02-14 18:50:38.95 spid19s        owner-list
2010-02-14 18:50:38.95 spid19s         owner id=process2e4b390 mode=S
2010-02-14 18:50:38.95 spid19s        waiter-list
2010-02-14 18:50:38.95 spid19s         waiter id=process2e4be40 mode=X
 requestType=convert
2010-02-14 18:50:38.95 spid19s       keylock hobtid=391941215944704 dbid=8
 objectname=bigpubs2008.dbo.stores indexname=UPK_storeid id=lockfd432c0 mode=S
 associatedObjectId=391941215944704
2010-02-14 18:50:38.95 spid19s        owner-list
2010-02-14 18:50:38.95 spid19s         owner id=process2e4be40 mode=S
2010-02-14 18:50:38.95 spid19s        waiter-list
2010-02-14 18:50:38.95 spid19s         waiter id=process2e4b390 mode=X
 requestType=convert
Monitoring Deadlocks with SQL Server Profiler
If
you still find the 1204 and 1222 trace flag output too difficult to
interpret, you’ll be pleased to know that SQL Server Profiler provides a
much more user-friendly way of capturing and examining deadlock
information. SQL Profiler provides three deadlock events that can be monitored:
Lock:Deadlock
Lock:Deadlock Chain
Deadlock Graph
The Lock:Deadlock and Lock:Deadlock Chain events aren’t really very useful in SQL Server 2008. The Lock:Deadlock
event generates a simple trace record that indicates when a deadlock
occurs between two processes. The SPID column indicates what process was
chosen as the deadlock victim. The Lock:Deadlock Chain event
generates a trace record for each process involved in the deadlock.
Unfortunately, neither of these trace events provides any detailed
information, such as the queries involved in the deadlock. (You would
need to also trace the T-SQL commands executed to capture this
information, but you would then be capturing all SQL statements, not
just those involved in the deadlock.)
Fortunately, SQL Server Profiler provides the new Deadlock Graph event. When this event is enabled, SQL Server Profiler populates the TextData
data column in the trace with XML data about the process and objects
involved in the deadlock. This XML data can then be used to display a
Deadlock Graph in SQL Server Profiler itself, or the XML can be
extracted to a file, which can be read in and viewed in SSMS. Figure 7 shows an example of a Deadlock Graph being displayed in SQL Server Profiler.
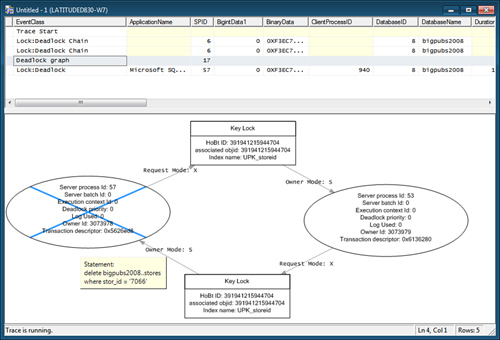
The Deadlock Graph displays the processes, resources,
and relationships between the processes and resources. The following
components make up a Deadlock Graph:
Process node— An oval containing information about each thread that performs a task involved in the deadlock (for example, INSERT, UPDATE, or DELETE).
Resource node—
A rectangle containing information about each database object being
referenced (for example, a table, an index, a page, a row, or a key).
Edge—
A line representing a relationship between a process and resource. A
request edge occurs when a process waits for a resource. An owner edge
occurs when a resource waits for a process. The lock mode is included in
the edge description.
Figure 37.15
displays the deadlock information for the processes involved in the
deadlocks displayed by the 1204 and 1222 trace flag output listed in the
previous sections. You can see that it displays the resource(s)
involved in the deadlock in the Resource node (Key Lock), the lock type held on the resource by each process (Owner Mode: S), the lock type being requested by each process (Request Mode: X),
and general information about each process (for example, SPID, deadlock
priority) displayed in each process node. The process node of the
process chosen as the deadlock victim has an X through it. If you place
the mouse pointer over a process node, a ToolTip displays the SQL
statement for that process involved in the deadlock. If the graph
appears too large or too small for the profiler window, you can
right-click anywhere within the graph to bring up a context menu that
allows you to increase or decrease the size of the graph.
To save a Deadlock Graph to a file for further
analysis at a later date, you can right-click the Deadlock Graph event
in the top panel and choose the Extract Event Data option. To save all
Deadlock Graph events contained in a SQL Server trace to one or more
files, you select File, Export, Extract SQL Server Events and then
choose the Extract Deadlock Events option. In the dialog that appears,
you have the option to save all Deadlock Graphs contained in the trace
to a single file or to save each to a separate file.
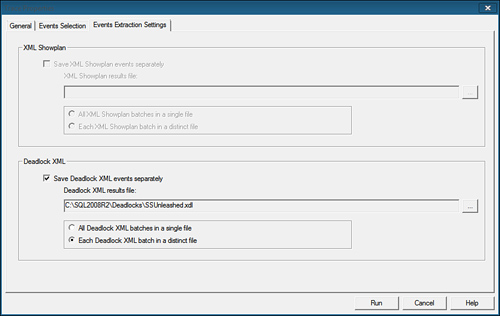
SQL Server Profiler can also save all Deadlock Graphs to a file automatically. When you are configuring a trace with the Deadlock Graph
event selected, you go to the Events Extraction Settings tab and click
Save Deadlock XML Events Separately. Then you specify the file where you
want the deadlock events to be saved. You can select to save all
Deadlock Graph events in a single XML file or to create a new XML file
for each Deadlock Graph. If you choose to create a new XML file for each
Deadlock Graph, SQL Server Profiler automatically appends a sequential
number to the filename. Figure 8
shows an example of the Events Extraction Settings tab to have a
Profiler trace automatically generate a separate file for each deadlock
trace.
You can use SSMS to open and analyze any SQL Server
Profiler Deadlock Graphs that you have saved to a file. To do so, in
SSMS you choose File, Open and then click File. In the Open File dialog
box, you select the .xdl file type as the type of file. You now have a filtered list of only deadlock files (see Figure 9). After you select the file or files, you are able to view them in SSMS.