The main tool for query
analysis in SQL Server 2008 is the Query Editor available in SSMS. The
SSMS Query Editor can produce a graphical execution plan that provides
analysis information in an intuitive and easy-to-view manner. You can
display the execution plan in one of two ways: the estimated execution
plan or the actual execution plan.
You can display an
estimated execution plan for the entire contents of the query window, or
for any highlighted SQL code in the query window, by choosing Display
Estimated Execution Plan from the Query menu. You can also invoke it by
using the Ctrl+L keyboard shortcut. This feature is useful for
displaying and analyzing execution plans for long-running queries or
queries with large result sets without having to actually run the query
and wait for the results to be returned.
You can also display the
actual execution plans for queries as they are executed by selecting the
Include Actual Execution Plan option from the Query menu or by using
the Ctrl+M keyboard shortcut. This option is a toggle that remains on
until you select it again to disable it. When this option is enabled,
your query results are displayed, along with an Execution Plan tab in
the Results panel. Click the Execution Plan tab to display the execution
plan for the query or queries that are executed. This option is
especially useful when you want to execute commands and compare the
actual runtime and I/O statistics with the execution plan estimates.
The graphical execution plans
display a series of nodes connected by lines. Each node is represented
by an icon, which indicates the logical and physical operator executed
for that node. The execution plan flows from right to left and top to
bottom, eventually ending at a statement icon, which indicates the type
of query that generated the execution plan.
This query might be a SELECT, INSERT, UPDATE, TABCREATE,
and so on. The arrows between the icons indicate the movement of rows
between operators. If the query window contains multiple statements,
multiple query execution plans are displayed in the Execution Plan tab.
For each query in the batch that is analyzed and displayed, the relative
cost of the query is displayed as a percentage of the total cost of the
batch.
To interpret and analyze
the execution plan output, you start with the farthest icon on the right
and read each ToolTip as you move left and down through the tree. Each
icon in the query tree is called a node, and icons displayed under each other participate in the same level of the execution tree.
Note
The displayed width of each of
the arrowhead lines in the graphical execution plan can indicate the
relative cost, in estimated number of rows, and the row and data size of
the data moving through the query. The smaller the width of the arrow,
the smaller the estimated row count or row size. Moving the cursor over
the line displays a ToolTip that indicates the estimated row count and
row and data size.
Figure 1 shows a sample SSMS graphical execution plan window.
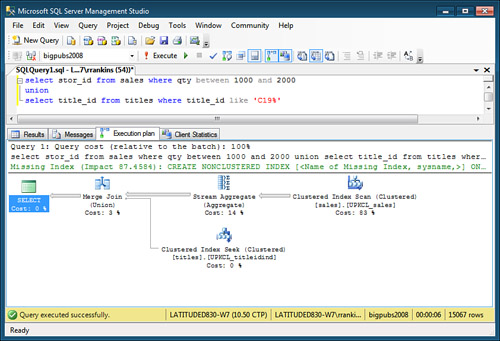
The following sections describe the icons and information provided in the graphical execution plan.
Execution Plan ToolTips
When
a graphical execution plan is presented in the Query Analyzer, you can
get more information about each node in the execution plan by moving the
mouse cursor over one of the icons. ToolTips for estimated execution
plans are slightly different from the ToolTips displayed for an
execution plan that is generated when a query is actually executed. The
ToolTip displayed for an estimated execution plan provides the following
information:
Physical Operation—
Lists the physical operation being performed for the node, such as a
Clustered Index Scan, Index Seek, Aggregate, Hash or Nested Loop Join,
and so on.
Logical Operation—
Lists the logical operation that corresponds with the physical
operation, such as the logical operation of a union being physically
performed as a merge join. The logical operator, if different from the
physical operator, is listed in parentheses below the physical operator
in the icon text in the graphical execution plan. Essentially, the
logical operators describe the relational operation used to process a
statement, while the physical operation describes how it is being
performed.
Estimated I/O Cost— Indicates the estimated relative I/O cost for the operation. Preferably, this value should be as low as possible.
Estimated CPU Cost— Lists the estimated relative CPU cost for the operation.
Estimated Number of Executions— Lists the estimated number of times this operation will be executed.
Estimated Operator Cost— Indicates the estimated cost to execute the physical operation. For best performance, you want this value as low as possible.
Estimated Number of Rows— Lists the estimated number of rows to be output by the operation and passed on to the parent operation.
Estimated Row Size— Indicates the estimated average row size of the rows being passed through the operator.
Estimated Subtree Cost— Lists the estimated cumulative total cost of this operation and all child operations preceding it in the same subtree.
Object— Indicates which database object is being accessed by the operation being performed by the current node.
Predicate— Indicates the search predicate specified for the object in the original query.
Seek Predicates— Indicates the search predicate being used in the seek against the index when an index seek is being performed.
Output List— Indicates which columns of data are being returned by the operation.
Ordered— Indicates whether the rows are being retrieved via an index in sorted order.
Node ID— Lists a unique identifier of the node within the execution plan.
Some operators may also
include the Actual Rebinds and Actual Rewinds counts. When an operator
is on the outer side of a loop join, Actual Rebinds equals 1 and Actual
Rewinds equals 0. If an operator is on the inner side of a loop join,
the sum of the number of rebinds and rewinds should equal the number of
rows returned by the table on the outer side of the join. A rebind means
that one or more of the correlated parameters of the join changed and
the inner side must be reevaluated. A rewind means that none of the
correlated parameters changed and the prior inner result set may be
reused.
Note
Depending on the type of operator and other query characteristics, not all the preceding items are displayed in the ToolTip.
The ToolTips for an
execution plan generated when the query is actually executed display the
same information as the estimated execution plan, but the ToolTip also
displays the actual number of rows returned by the operation and the
actual number of executions. This information is useful in determining
the effectiveness of the statistics on the column or index because it
helps you compare how closely the estimated row count matches the actual
row count. If a significant difference exists (significant being a
relative term), you might need to update the statistics and possibly
increase the sample size used when the statistics are updated to
generate more accurate statistics.
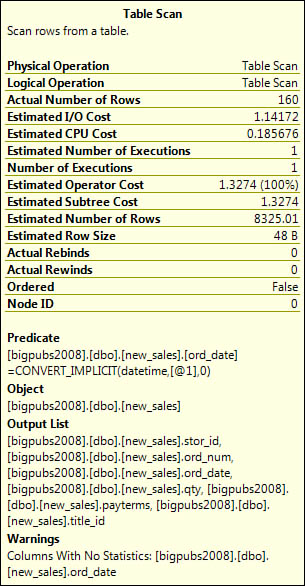
Figure 2 displays a sample ToolTip. Notice the difference between the Estimated Number of Rows value (8325.01) and the Actual Number of Rows value (160). This indicates an obvious issue with missing or out-of-date statistics.
Note
To achieve the large difference between the actual row count and estimated row count shown in Figure 36.2, we disabled the AUTO-CREATE STATISTICS option for the database. If this option is not disabled, SQL Server automatically generates the missing statistics on the ord_date
column before generating the execution plan. With the column statistics
generated, it would likely come up with a better row estimate.
In this example, the ToolTip
displays the information for a Table Scan physical operation. The
Estimated I/O Cost and Estimated CPU Cost provide critical information
about the relative performance of this query. You want these numbers to
be as low as possible.
The Estimated Subtree Cost
displays cumulated costs for this node and any previous nodes that feed
into it. This number increases as you move from right to left in the
execution plan diagram. For the next-to-last icon for a query execution
path (the icon leading into the statement icon), the ToolTip displays
the Total Estimated Subtree Cost for the entire query.
Note
The
total Estimated Subtree Cost displayed for the statement icon is the
cost compared against the query governor cost limit setting, if enabled,
to determine whether the query will be allowed to run.
The Predicate section
outlines the predicates and parameters the query uses. This information
is useful in determining how the Query Optimizer is interpreting your
search arguments (SARGs) and if they are being interpreted as SARGs that
can be optimized effectively.
Putting all the ToolTip
information together provides the key to understanding each operation
and its potential cost. You can use this information to compare various
incarnations of a query to determine whether changes to the query result
in improved query plans and whether the estimated values are consistent
with actual values.
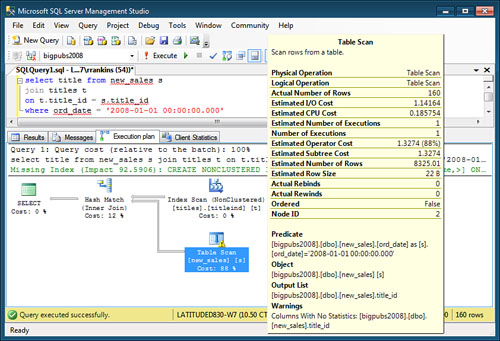
Note
If the Query Optimizer has
issued a warning about one of the execution plan operators, such as
missing column statistics or missing join predicates, the icon is
displayed with a yellow warning triangle (see Figure 3).
These warnings indicate a condition that can cause the Query Optimizer
to choose a less efficient query plan than otherwise expected. The
ToolTip for the operation with the warning icon includes a Warnings item
that indicates why the warning was generated.
If you prefer to view the
information about a node in an execution tree in more detail and with
something more stable than a ToolTip, you can right-click the node and
select Properties. This brings up the Properties window, as shown in Figure 4.
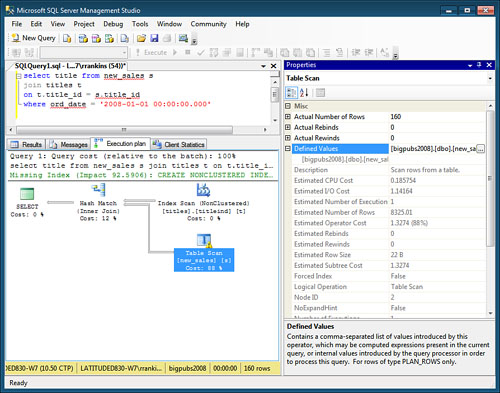
The Properties window
provides all the same information available in the ToolTip and also
provides some more detailed information, along with descriptions of the
types of information provided.