|
SQL Server Reporting Services (SSRS) is an enterprise reporting platform with which you can rapidly build and deploy reports
for SQL Server data. These reports are interactive and can be deployed
in different ways such as in local folders, on the web, through custom
applications, or to SharePoint. You can use unidimensional,
multidimensional, or hierarchical data sources to create SSRS reports.
To use SSRS with SharePoint, you must install a special SSRS
plug-in for SharePoint. This makes it possible to create a new Report
Server site in SharePoint—which supports the rendering of the SSRS
reports. The SSRS server component that is installed is managed through a
web services infrastructure and uses the SOAP protocol. For more
information on SSRS installation prerequisites, see http://msdn.microsoft.com/en-us/library/bb522676.aspx.
SSRS has also been around
for a while, so many IT pros and SharePoint administrators have some
knowledge of it. It is fairly straightforward to set up, but it does
require some configuration. For example, when you first install
SharePoint, you have the option to install a SharePoint instance that is
SSRS enabled. To work through this exercise, you must have an existing
SSRS-enabled SharePoint site set up and configured. When you have an
SSRS-enabled instance of SharePoint up and running, you then need to
configure SSRS for use. These steps are not difficult and are covered in
the following Microsoft TechNet installation document: http://technet.microsoft.com/en-us/library/aa905871.aspx. Configuration documentation can be found here: http://msdn.microsoft.com/en-us/library/bb326213(SQL.105).aspx.
To complete this exercise, you’ll also need to make sure that you install the SQL Server Business Intelligence Development Studio (BIDS). BIDS is included with the evaluation edition of SQL Server 2008 R2, which you can download for free from here: http://technet.microsoft.com/en-us/evalcenter/ee315247.aspx.
Note:
More Info If you’ve never used BIDS, you can also get some additional help here: http://msdn.microsoft.com/en-us/library/ms173767.aspx.
Assuming that you do have BIDS installed and have a SharePoint report Server set up, you are ready to begin the exercise.
1. Create a Reporting Services Report by Using SQL Azure Data
1.1. Create a Reporting Services Report by Using SQL Azure Data
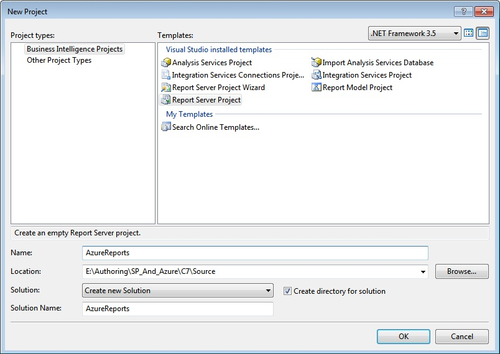
Open Microsoft Visual Studio 2008 BIDS and then click File | New Project. In
the New Project dialog box, select Business Intelligence Projects and
click Report Server Project. Provide a name for the project (such as AzureReports).
Click
OK. When the new project has been created, you’ll have three default
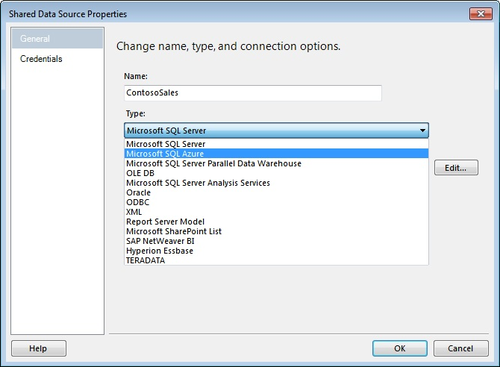
folders in the project: Shared Data Sources, Shared Datasets, and Reports. Right-click the Shared Data Sources folder and choose Add New Data Source. In the Shared Data Source Properties dialog box, click the General tab and then provide a name for the data source (such as ContosoSales). In the Type drop-down list, select Microsoft SQL Azure as the data source you want to use.
Click Edit to add the server name, credentials, and database name you want to use. For example, you’ll enter servername.database.cloud.net for name, click Use SQL Server Authentication and add your user name and password, and then select (or type) the database name. The
project now adds the data connection to your solution as an .rds file
in the Shared Data Sets folder (for example, ContosoStores.rds). You’ll
also see that the connection string has been added to the Shared Data
Source Properties dialog box after you connect to the database. The next
step, then, is to add a data set that you will use to display in the
SSRS report. To add a data set, right-click the Shared Datasets folder, provide a name for the data set (such as ContosoSalesDS),
and enter a specific SQL command (either a SQL query or a stored
procedure). Note that you can add multiple data sets if you want. Add a
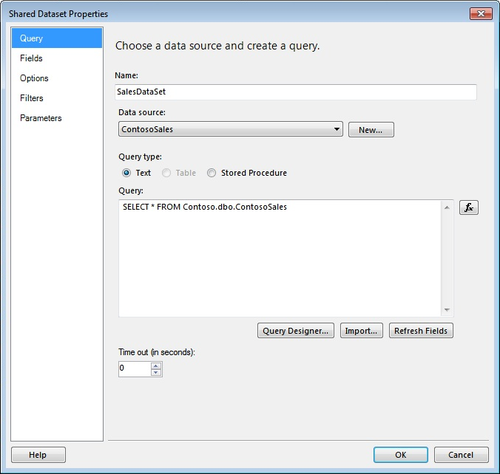
simple SQL query to select all records from the ContosoSales table in
the Contoso database, as shown here: SELECT * FROM Contoso.dbo.ContosoSales
At this point, you should have something that looks like the following graphic in front of you.
You
can explore some of the other options in the Shared Dataset Properties
dialog box. When you are done, click OK to complete the configuration of
the SQL Azure data source. SSRS
allows you to create a custom form that will display the data. The
amount of effort you put in here is up to you. If you want to simply
display the data in SharePoint via your Report
Server site without too intricate of a design, you can use a couple of
controls to display your data. The form works in concert with the data
sets you create. You can also use the Report Wizard to create a simple
and lightly designed form. To create the form, right-click the Reports
folder and select Add New Report. This invokes the Report Wizard, which
you can use to build one or more reports that work against the SQL
Azure data source. Leave the default data source selected (Shared Data Source), and click Next. In the next step, you can build a query for the report. You can use the graphical Query Builder tool (by clicking the Query Builder button), or you can type a SQL command in the Query String window. Type SELECT * FROM Contoso.dbo.ContosoSales in the Query String window. In the Report Type dialog box, select Tabular, and then click Next. You
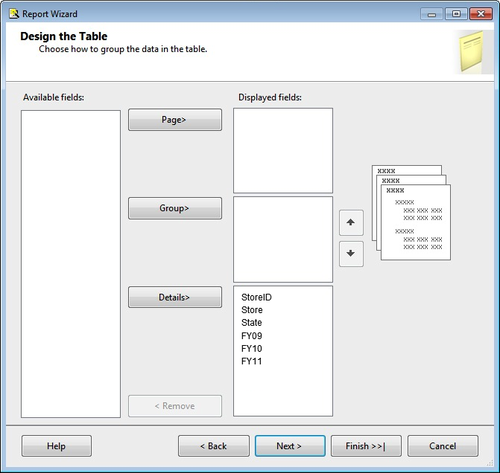
can now design the report structure on the Design The Table page. Add
all of the records to the Details view by clicking each field in the
Available Fields list and then clicking the Details button. Do this for
all of the fields, as shown in the following graphic.
Click Next. You can now select a style for your report. Click one of the options in the list and click Next. You’re now presented with the final step in the wizard, which is a summary page. Provide a name for the report (such as MyContosoStoresReport), select the Preview Report check box, and click Finish. At
this point, you’ve created the core components for the report that
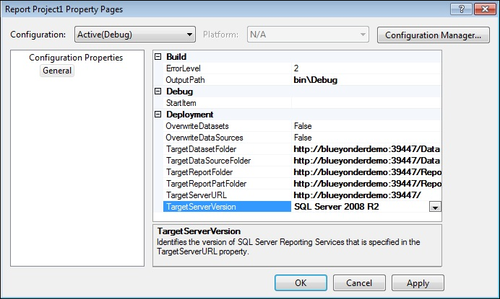
you’ll deploy to SharePoint. To deploy the report, you need to edit the
properties of the project. The properties you edit will point to a set
of document
libraries in SharePoint. Thus, before you can deploy the report, you
need to navigate to your SharePoint Report Server site and create a new
document library for your data set, data connection, and report. To edit the properties of the project, right-click the project in the Solution Explorer and select Properties. Edit the target folders in the Property Pages dialog box to ensure that they point to document libraries in SharePoint. For example, add something like http://blueyonderdemo:39447/Data as the document library in your SharePoint site for your data sets and connections, and http://blueyonderdemo:39447/Reports as the library for your reports.
To
deploy the report to SharePoint, right-click the top-level project in
the Solution Explorer and select Deploy. This deploys the form, data
connection, and data set to the specific SharePoint folders you
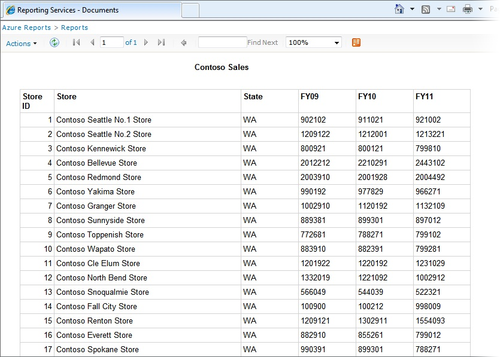
configured. When
you’ve deployed the report to SharePoint, you can then navigate to your
SharePoint site—the Report Server site you built to house your SSRS
reports. Click the document library in which you deployed the report,
and then click the report. As shown in the following example graphic,
your report renders inside of your SharePoint site.
The report you created
was obviously quite simple; however, you can return to your Visual
Studio 2008 project and create more complex queries that result in more
creative and complex reporting.
|