2. Creating a Dashboard
With the WCF
service deployed and tested (at least in a browser), you are now ready
to move on to the next exercise. Note that a good practice is to test
the WCF
service with a simple application, such as a console or Windows Forms
application. This allows you to set breakpoints in the code to validate
that the right data is being returned from your service call and to just
make sure that everything is working the way you want it to work.
Creating a dashboard in
SharePoint does not necessarily require code. As a best practice, you
should always look to the out-of-the-box functionality before engaging
in custom development. Excel Services and Key Performance Indicators
(KPIs) are a great way to use the out-of-the-box functionality to build dashboards
in SharePoint. However, there might be times when requirements dictate
the need for something more advanced; perhaps something with more
dynamic functionality or an advanced look and feel. Enter Silverlight.
2.1. Create a Simple Sales Dashboard by Using the Silverlight Toolkit
Create a new Silverlight application by right-clicking the solution and selecting Add | New Project.
Select Silverlight and then click Silverlight Application. Provide a name for the project (such as Chart_Sample) and click OK. You do not need an additional host website as the test harness for the Silverlight project.
Right-click the project and select Add References. Click the .NET tab and select the following:
System.Windows.Controls.dll
System.Windows.Controls.Data.Input.dll
System.Windows.Controls.DataVisualization.Toolkit.dll
System.Windows.Controls.Toolkit.dll
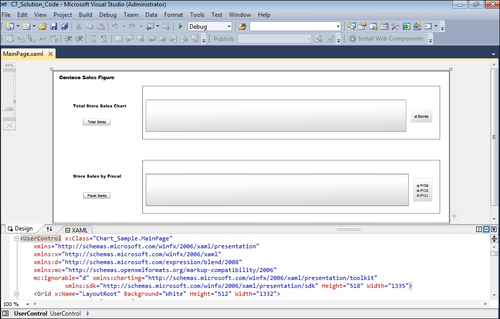
Double-click
the MainPage.xaml file to open the Designer view. In the XAML view,
amend the XAML as shown in the bolded code here:
<UserControl x:Class="Chart_Sample.MainPage"
    xmlns="http://schemas.microsoft.com/winfx/2006/xaml/presentation"
    xmlns:x="http://schemas.microsoft.com/winfx/2006/xaml"
    xmlns:d="http://schemas.microsoft.com/expression/blend/2008"
    xmlns:mc="http://schemas.openxmlformats.org/markup-compatibility/2006"
    mc:Ignorable="d" xmlns:charting="http://schemas.microsoft.com/winfx/2006/xaml/
presentation/toolkit"
             xmlns:sdk="http://schemas.microsoft.com/winfx/2006/xaml/presentation/sdk"
Height="518" Width="1335">
    <Grid x:Name="LayoutRoot" Background="White" Height="512" Width="1332">
        <Canvas Margin="0,0,0,-2">
            <charting:Chart x:Name="chrtFiscalYearSales" Grid.Row="0" Grid.Column="1"
Height="180" Width="1000"
                            Canvas.Left="300" Canvas.Top="300">
                <charting:Chart.Series>
                    <charting:ColumnSeries
                    Title="Fiscal"
                    DependentValueBinding="{Binding Value}"
                    IndependentValueBinding="{Binding Key}" />
                </charting:Chart.Series>
            </charting:Chart>
        </Canvas>
        <Canvas>
            <charting:Chart x:Name="chrtTotalFYSales" Height="180" Width="1000"
Canvas.Left="300" Canvas.Top="50">
            <charting:Chart.Series>
                <charting:ColumnSeries
                    Title="Stores"
                    DependentValueBinding="{Binding Value}"
                    IndependentValueBinding="{Binding Key}" />
            </charting:Chart.Series>
        </charting:Chart>
        <Button Content="Show Sales" Height="23" HorizontalAlignment="Left"
Margin="25,265,0,0" Name="btnShowSales" VerticalAlignment="Top" Width="93"
                Canvas.Left="75" Canvas.Top="-105" Click="btnShowSales_Click" />
            <sdk:Label Canvas.Left="67" Canvas.Top="102" Content=
"Total Store Sales Chart" FontFamily="Arial Black" FontSize="14" Height="28"
Name="lblOptions" Width="185" />
            <sdk:Label Height="28" HorizontalAlignment="Left" FontSize="16"
FontFamily="Arial Black" Name="lblTitle"
                   Content="Contoso Sales Figures" VerticalAlignment="Top" Width="185"
Canvas.Left="20" Canvas.Top="10" />
            <Button Canvas.Left="100" Canvas.Top="440" Content="Forecast" Height="23"
Name="btnCalcForecast" Width="93" Click="btnCalcForecast_Click" />
            <ComboBox Canvas.Left="140" Canvas.Top="391" Height="23"
Name="cmbobxFiscalYear" Width="132">
                <ComboBoxItem Content="FY 09"/>
                <ComboBoxItem Content="FY 10" />
                <ComboBoxItem Content="FY 11" />
            </ComboBox>
            <sdk:Label Canvas.Left="43" Canvas.Top="391" Content="Fiscal Year:"
FontFamily="Arial Black" FontSize="12" Height="28" Name="label2" Width="98" />
            <sdk:Label Canvas.Left="67" Canvas.Top="340" Content="Store Sales by
Fiscal" FontFamily="Arial Black" FontSize="14" Height="28" Name="label3"
Width="185" />
        </Canvas>
    </Grid>
</UserControl>
When you’ve added the new references, your UI should look something similar to the following graphic.
Right-click the main project and add a new class by selecting Add | Class. Name the class FiscalData09 and add two properties, as shown in the following code (note that the using statements have been removed for brevity):
...
namespace Chart_Sample
{
    public class FiscalData09
    {
        public string StoreID { get; set; }
        public string FY09Sales { get; set; }
    }
}
Add two more classes the same way you added FiscalData09, one called FiscalData10 and another called FiscalData11. These should look similar to the first, as in the following code:
...
namespace Chart_Sample
{
    public class FiscalData10
    {
        public string StoreID { get; set; }
        public string FY10Sales { get; set; }
    }
}

...
namespace Chart_Sample
{
    public class FiscalData11
    {
        public string StoreID { get; set; }
        public string FY11Sales { get; set; }
    }
}
Add another class called StoreInfo, which should look like the following. Again, the using statements have been removed for brevity:
...

namespace Chart_Sample
{
    public class StoreInfo
    {
        public string StoreName { get; set; }
        public string StoreID { get; set; }
        public string FiscalYear09Sales { get; set; }
        public string FiscalYear10Sales { get; set; }
        public string FiscalYear11Sales { get; set; }
        public string TotalSales { get; set; }
    }
}
Double-click the MainPage.xaml.cs file and amend the code in the file as shown in the bolded code here:
using System;
using System.Collections.Generic;
using System.Linq;
using System.Net;
using System.Windows;
using System.Windows.Controls;
using System.Windows.Documents;
using System.Windows.Input;
using System.Windows.Media;
using System.Windows.Media.Animation;
using System.Windows.Shapes;
using System.Windows.Controls.DataVisualization.Charting;
using Chart_Sample.AzureContosoSalesDataService;

namespace Chart_Sample
{
    public partial class MainPage : UserControl
    {
        List<StoreInfo> listOfAggregateStoreSales = new List<StoreInfo>();
        List<FiscalData09> listOfFiscalStoreSales1 = new List<FiscalData09>();
        List<FiscalData10> listOfFiscalStoreSales2 = new List<FiscalData10>();
        List<FiscalData11> listOfFiscalStoreSales3 = new List<FiscalData11>();
        ContosoServiceClient azureSalesDataSvc = new ContosoServiceClient();

        StoreInfo[] totalSalesClassArray = null;
        FiscalData09[] fiscalSalesClassArray1 = null;
        FiscalData10[] fiscalSalesClassArray2 = null;
        FiscalData11[] fiscalSalesClassArray3 = null;

        public MainPage()
        {
            InitializeComponent();
        }

        private void btnShowSales_Click(object sender, RoutedEventArgs e)
        {
            GetStoreSalesData();
        }

        private void GetStoreSalesData()
        {
            azureSalesDataSvc.GetContosoStoreSalesAsync();
            azureSalesDataSvc.GetContosoStoreSalesCompleted+=
new EventHandler<GetContosoStoreSalesCompletedEventArgs>(azureSalesDataSvc_
GetContosoStoreSalesCompleted);
        }

        void azureSalesDataSvc_GetContosoStoreSalesCompleted(object sender,
GetContosoStoreSalesCompletedEventArgs e)
        {
            Dictionary<string, int> chartTotalSalesValues =
new Dictionary<string, int>();

            var returnData = e.Result;

            foreach (var item in returnData)
            {
                StoreInfo tempItem = new StoreInfo();
                tempItem.StoreName = item.StoreName;
                tempItem.StoreID = item.StoreID;
                tempItem.FiscalYear09Sales = item.FY09Sales;
                tempItem.FiscalYear10Sales = item.FY10Sales;
                tempItem.FiscalYear11Sales = item.FY11Sales;
                tempItem.TotalSales = item.TotalSales.ToString();
                listOfAggregateStoreSales.Add(tempItem);
            }

            totalSalesClassArray = (StoreInfo[])listOfAggregateStoreSales.ToArray();

            int i = 0;
            foreach (StoreInfo element in totalSalesClassArray)
            {
                chartTotalSalesValues.Add(totalSalesClassArray[i].StoreID,
Convert.ToInt32(totalSalesClassArray[i].TotalSales));
                i++;
            }

            ((ColumnSeries)this.chrtTotalFYSales.Series[0]).ItemsSource =
chartTotalSalesValues;
        }

        private void btnShowFiscalSales_Click(object sender, RoutedEventArgs e)
        {
            GetFiscalYearData();
        }

        private void GetFiscalYearData()
        {
            azureSalesDataSvc.GetFiscalSalesDataAsync();
            azureSalesDataSvc.GetFiscalSalesDataCompleted +=
new EventHandler<GetFiscalSalesDataCompletedEventArgs>(azureSalesDataSvc_
GetFiscalSalesDataCompleted);
        }

        void azureSalesDataSvc_GetFiscalSalesDataCompleted(object sender,
GetFiscalSalesDataCompletedEventArgs e)
        {
            Dictionary<string, int> chartFiscalSalesValues1 =
new Dictionary<string, int>();
            Dictionary<string, int> chartFiscalSalesValues2 =
new Dictionary<string, int>();
            Dictionary<string, int> chartFiscalSalesValues3 =
new Dictionary<string, int>();

            var returnData = e.Result;

            foreach (var item in returnData)
            {
                FiscalData09 tempFY09Item = new FiscalData09();
                tempFY09Item.FY09Sales = item.FY09Sales;
                listOfFiscalStoreSales1.Add(tempFY09Item);

                FiscalData10 tempFY10Item = new FiscalData10();
                tempFY10Item.FY10Sales = item.FY10Sales;
                listOfFiscalStoreSales2.Add(tempFY10Item);

                FiscalData11 tempFY11Item = new FiscalData11();
                tempFY11Item.FY11Sales = item.FY11Sales;
                listOfFiscalStoreSales3.Add(tempFY11Item);
            }

            fiscalSalesClassArray1 = (FiscalData09[])listOfFiscalStoreSales1.
ToArray();
            fiscalSalesClassArray2 = (FiscalData10[])listOfFiscalStoreSales2.
ToArray();
            fiscalSalesClassArray3 = (FiscalData11[])listOfFiscalStoreSales3.
ToArray();

                int x = 0;
                int a = 1;

                foreach (FiscalData09 element in fiscalSalesClassArray1)
                {
                    chartFiscalSalesValues1.Add(a.ToString(), Convert.ToInt32
(fiscalSalesClassArray1[x].FY09Sales));
                    x++;
                    a++;
                }
                ((LineSeries)this.chrtFiscalYearSales.Series[0]).ItemsSource =
chartFiscalSalesValues1;
                chartFiscalSalesValues1.Clear();

                int y = 0;
                int b = 1;

                foreach (FiscalData10 element in fiscalSalesClassArray2)
                {
                    chartFiscalSalesValues2.Add(b.ToString(), Convert.ToInt32
(fiscalSalesClassArray2[y].FY10Sales));
                    y++;
                    b++;
                }
                ((LineSeries)this.chrtFiscalYearSales.Series[1]).ItemsSource =
chartFiscalSalesValues2;
                int z = 0;
                int c = 1;
                foreach (FiscalData11 element in fiscalSalesClassArray3)
                {
                    chartFiscalSalesValues3.Add(c.ToString(),
Convert.ToInt32(fiscalSalesClassArray3[z].FY11Sales));
                    z++;
                    c++;
                }
                ((LineSeries)this.chrtFiscalYearSales.Series[2]).ItemsSource =
chartFiscalSalesValues3;
        }
    }
}
When the data is returned, the
next goal is to parse the data and get it into a format that can be used
for binding to the charts in the Silverlight application. A data
structure that is conversant with these charts is the Dictionary object that is made of a string and an int. The goal in most of this code, then, is to cycle through the returned data (returnData) to eventually populate and convert the data structure from list collection to dictionary so it can populate the charts.
With
the Silverlight application complete, build the application by pressing
F6 on your keyboard. You are now ready to deploy the Silverlight
application to SharePoint.
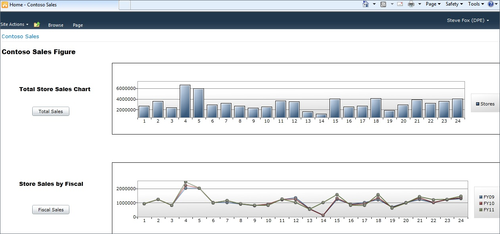
You can deploy the Silverlight application; that is, you can upload the XAP
file to a document library and use the out-of-the-box Silverlight Web
Part to load the XAP from the document library. If you do this, your
application in SharePoint will look like the following screen. You click
Total Sales and Fiscal Sales to trigger the WCF service call and to populate the charts.
At this point, you’ve created a decent-looking BI
application, but it’s pretty basic; you haven’t added many frills to
the user experience. For example, you might additionally want to format
the values so they appear in a specific currency format, or you might
want to have specific tooltips displayed with information that is
particular to a store (or chart object). You can do these things (and
more) by adding code with the Silverlight Toolkit. You can get more information from the Silverlight Toolkit overview at http://silverlight.codeplex.com/wikipage?title=Silverlight%20Toolkit%20Control%20Overview%20Pg1.
You can also use several
different options to wrap the Silverlight application with a normal Web
Part. For example, the following shows a code snippet that is a Web Part
class that points to the XAP file that you’ve uploaded into SharePoint.
Creating this Web Part is fairly simple: you create an empty SharePoint
project, add a Web Part as a new item to that project, and then edit
the main Web Part class code as shown in the bolded code below. The link
to which the Web Part code points is where you upload your Silverlight
application in SharePoint :
...

namespace SPSalesChartProject.SalesChart
{
    [ToolboxItemAttribute(false)]
    public class SalesChart : WebPart
    {
        string htmlObjectCode = null;
        protected override void CreateChildControls()

        {

          htmlObjectCode = "'<object data='data:application/x-silverlight,'" +
                            "type='application/x-silverlight' width='1500' height='500'>" +
                            "<param name='source' value='http://blueyonderdemo/XAPS/
Chart_Sample.xap'/>" + "</object>';";
          this.Controls.Add(new LiteralControl(htmlObjectCode.ToString()));
        }
    }
}
Note that this URL is in the object tag value and is the link that points back to the XAP file you would upload to SharePoint.
Alternatively, to get the XAP
file into SharePoint, you can add a module as a new item into your
SharePoint project and reference the XAP file within the solution to
have that file deployed to SharePoint when you deploy the Web Part. The elements.xml
file in the module should look similar to the following, to ensure that
the Web Part will properly load the Silverlight application:
<?xml version="1.0" encoding="utf-8"?>
<Elements xmlns="http://schemas.microsoft.com/sharepoint/">
  <Module Name="SLWrapper">
  <File Path="SLWrapper\Chart_Sample.xap" Url=" XAPS/Chart_Sample.xap" />
</Module>
</Elements>
Beyond using the out-of-the-box Silverlight Web Part that is included with SharePoint, you can use the Visual
Studio Extensibility projects that provide a Silverlight Web Part as a
new item in a SharePoint project. A good blog post on the Web Parts,
along with a pointer to the Codeplex project, can be found here: http://blogs.msdn.com/b/pstubbs/archive/2010/04/26/sharepoint-2010-extensibility-projects-silverlight-web-parts.aspx.
Using the custom Silverlight Web Part is arguably one of the better
ways to integrate with SharePoint, because you get ease-of-deployment
and debugging capabilities by using this method.