To monitor the performance of
a system, you need to keep track of locking activity in SQL Server. The
following are the most commonly used methods to do so:
Querying the sys.dm_tran_locks dynamic management view directly
Viewing locking activity with SQL Server Profiler
Monitoring locks with Performance Monitor
Querying the sys.dm_tran_locks View
The sys.dm_tran_locks dynamic management
view returns information about all the locks currently granted or
waiting to be granted in SQL Server. (The information is populated from
the internal lock management structures in SQL Server 2008.) This view
provides no historical information; rather, the data in this view
corresponds to live Lock Manager information. This data can change at any time for subsequent queries of the view as locks are acquired and released.
The information returned by the view can be divided
into two main groups: resource information and lock request information.
The resource information describes the resource on which the lock
request is being made, and the request information provides details on
the lock request itself. Table 1 describes the most useful data columns returned by the sys.dm_tran_locks view.
Table 1. Useful Columns Returned by the sys.dm_tran_locks View
| Column Name | Description |
|---|
| resource_type | Indicates the type of resource the lock is being held or requested on. |
| resource_subtype | Indicates a subtype of the resource_type, if any. |
| resource_database_id | Indicates the database ID of the database where the resource resides. |
| resource_description | Provides information about the resource that is not available from other resource columns. |
| resource_associated_entity_id | Indicates the ID of the entity in a database that the resource is associated with. |
| resource_lock_partition | Indicates the ID of the associated partition for a resource that is partitioned. |
| request_mode | Indicates the lock mode of the request that has been granted or is being waited on. |
| request_type | Indicates the request type. (The only current value is LOCK.) |
| request_status | Indicates the current status of this request (GRANT, CONVERT, or WAIT). |
| request_reference_count | Returns an approximate number of times the same requestor has requested this resource. |
| request_lifetime | Specifies a code indicating when the lock on the resource is released. |
| request_session_id | Indicates the ID of the session that generated the corresponding request. |
| request_exec_context_id | Indicates the ID of the execution context of the process that generated the lock request. |
| request_request_id | Indicates the batch ID of the process that generated the request. |
| request_owner_type | Indicates the type of entity that owns the request. Possible values include, but are not limited to, TRANSACTION, CURSOR, and SESSION. |
| request_owner_id | Specifies
the ID of the specific owner of this request. This value is used for
transactions for which this is the transaction ID. |
| request_owner_guid | Indicates
the GUID of the specific owner of the lock request. This value is used
only by a distributed transaction where the value corresponds to the MS
DTC GUID for that transaction |
| request_owner_lockspace_id | Represents
the lockspace ID of the requestor. The lockspace ID determines whether
two requestors are compatible with each other and can be granted locks
in modes that would otherwise conflict with one another. |
| lock_owner_address | Indicates the memory address of the internal data structure used to track the request. |
Table 2 lists the possible lock request modes that can be displayed in the request_mode column of the sys.dm_tran_locks view.
Table 2. Lock Request Modes
| Value | Lock Type | Description | Request Mode |
|---|
| 1 | N/A | No access provided to the requestor | NULL |
| 2 | Schema | Schema stability lock | Sch-S |
| 3 | Schema | Schema modification lock | Sch-M |
| 4 | Shared | Acquisition of a shared lock on the resource | S |
| 5 | Update | Acquisition of an update lock on the resource | U |
| 6 | Exclusive | Exclusive lock granted on the resource | X |
| 7 | Intent | Intent for a shared lock | IS |
| 8 | Intent | Intent for an update lock | IU |
| 9 | Intent | Intent for an exclusive lock | IX |
| 10 | Intent | Shared lock with intent for an update lock on subordinate resources | SIU |
| 11 | Intent | Shared lock with intent for an exclusive lock on subordinate resources | SIX |
| 12 | Intent | Update lock with an intent for an exclusive lock on subordinate resources | UIX |
| 13 | Bulk | BULK UPDATE lock used for bulk copy operations | BU |
| 14 | Key-Range | Shared lock on the range between keys and shared lock on the key at the end of the range; used for serializable range scan | Range_S_S |
| 15 | Key-Range | Shared lock on the range between keys, with an update lock on the key at the end of the range | Range_S_U |
| 16 | Key-Range | Exclusive lock used to prevent inserts into a range between keys | RangeIn-N |
| 17 | Key-Range | Key-range conversion lock created by overlap of RangeIn-N and shared (S) locks | RangeIn-S |
| 18 | Key-Range | Key-range conversion lock created by overlap of RangeIn-N and update (U) locks | RangeIn-U |
| 19 | Key-Range | Key-range conversion lock created by overlap of RangeIn-N and exclusive (X) locks | RangeIn-X |
| 20 | Key-Range | Key-range conversion lock created by overlap of RangeIn-N and RangeS_S locks | RangeX-S |
| 21 | Key-Range | Key-Range conversion lock created by overlap of RangeIn-N and RangeS_U locks | RangeX-U |
| 22 | Key-Range | Exclusive lock on range between keys, with an exclusive lock on the key at the end of the range | RangeX-X |
Listing 1 provides an example of a query against the sys.dm_tran_locks view.
Listing 1. An Example of a Query Against the sys.dm_tran_locks View
select str(request_session_id, 4,0) as spid,
       convert (varchar(12), db_name(resource_database_id)) As db_name,
       case when resource_database_id = db_id() and resource_type = 'OBJECT'
            then convert(char(20), object_name(resource_Associated_Entity_id))
            else convert(char(20), resource_Associated_Entity_id)
            end as object,
       convert(varchar(12), resource_type) as resrc_type,
       convert(varchar(12), request_type) as req_type,
       convert(char(1), request_mode) as mode,
       convert(varchar(8), request_status) as status
   from sys.dm_tran_locks
order by request_session_id, 3 desc
go

spid db_name      object           resrc_type req_type mode status
---- ---------- ---------------- ------------ -------- ---- --------
 52 msdb          0                DATABASE  LOCK    S   GRANT
 55 bigpubs2008   titles           OBJECT    LOCK    I   GRANT
 55 bigpubs2008   sales_qty_rollup OBJECT    LOCK    X   GRANT
 55 bigpubs2008   sales            OBJECT    LOCK    X   GRANT
 55 bigpubs2008   679707671068672  PAGE      LOCK    I   GRANT
 55 bigpubs2008   679707671068672  KEY       LOCK    X   GRANT
 55 bigpubs2008   398232694358016  KEY       LOCK    X   GRANT
 55 bigpubs2008   398232694358016  PAGE      LOCK    I   GRANT
 55 bigpubs2008   0                DATABASE  LOCK    S   GRANT
 56 msdb          0                DATABASE  LOCK    S   GRANT
 58 bigpubs2008   sales            OBJECT    LOCK    I   WAIT
 58 bigpubs2008   0                DATABASE  LOCK    S   GRANT
|
Note that the query in Listing 1 contains a CASE expression for displaying the object name. If the resource type is OBJECT
and the database ID of the locked resource is the same as the current
database context, it returns the object name; otherwise, it returns the
object ID because the object_name() function operates only in the current database context.
Tip
To save yourself the trouble of having to type in the query listed in Listing 37.1,
or having to read it in from a file each time you want to run it, you
might want to consider creating your own stored procedure or view that
invokes this query.
Note
In SQL Server 2005, you could monitor lock activity
via the Activity Monitor in SQL Server Management Studio (SSMS). If
you’re looking for this tool in SQL Server 2008, you won’t find it. For
some reason, this feature was removed from SSMS in SQL Server 2008. The
only locking information provided by the SSMS Activity Monitor in SQL
Server 2008 is the indication of lock blocking and wait time provided by
the Process Monitor and the Lock Waits information provided by the
Resource Waits Monitor. There is no GUI-based lock monitoring tool
provided with SQL Server 2008 to display the specific locks being held
by processes or the locks being held on objects as there was in SQL
Server 2005.
Viewing Locking Activity with SQL Server Profiler
Another
tool to help you monitor locking activity in SQL Server 2008 is SQL
Server Profiler. SQL Server Profiler provides a number of lock events
that you can capture in a trace. The trace information can be viewed in
real-time or saved to a file or database table for further analysis at a
later date. Saving the information to a table allows you to run
different reports on the information to help in the analysis.
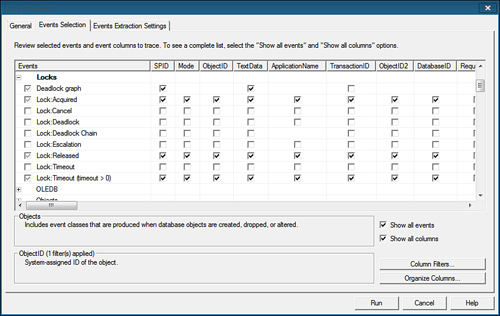
SQL Profiler provides the following lock events that can be captured in a trace:
Lock:Acquired— Indicates when a lock on a resource, such as a data page or row, has been acquired.
Lock:Cancel— Indicates when the acquisition of a lock on a resource has been canceled (for example, as the result of a deadlock).
Lock:Deadlock— Indicates when two or more concurrent processes have deadlocked with each other.
Lock:Deadlock Chain—
Provides the information for each of the events leading up to a
deadlock. This information is similar to that provided by the 1204 trace
flag.
Lock:Escalation—
Indicates when a lower-level lock has been converted to a higher-level
lock (for example, when page-level locks are escalated to table-level
locks).
Lock:Released— Indicates that a process has released a previously acquired lock on a resource.
Lock:Timeout— Indicates that a lock request that is waiting on a resource has timed out due to another transaction holding a blocking lock.
Lock:Timeout (timeout >0)— Is similar to Lock:Timeout but does not include any events where the lock timeout is 0 seconds.
Deadlock Graph— Generates an XML description of a deadlock.
Figure 1 shows an example of choosing a set of locking events to monitor with SQL Server Profiler.
SQL
Server Profiler also provides a number of data values to display for
the events being monitored. You might find the following data columns
useful when monitoring locking activity:
spid— The process ID of the process that generated the event.
EventClass— The type of event being captured.
Mode— For lock monitoring, the type of lock involved in the captured event.
ObjectID— The ID of the object involved in the locking event—that is, the object that the lock is associated with.
DatabaseID— The ID of the database involved in the locking event
TextData— The query that generated the lock event.
LoginName— The login name associated with the process.
ApplicationName— The name of the application generating the lock event.
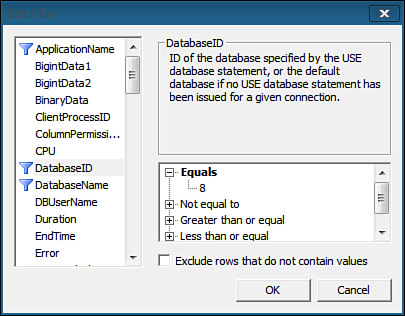
Keep in mind that many internal system processes also
acquire locks in SQL Server. If you want to filter out those processes
and focus on specific processes, users, or applications, you use the
filters in SQL Server Profiler to include the information you want to
trace or exclude the information you don’t want to trace (see Figure 2).
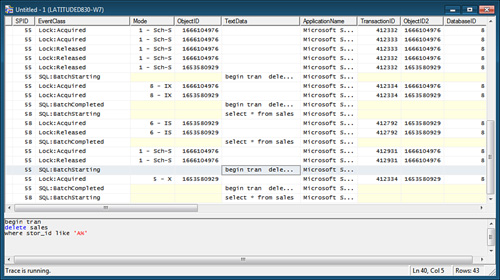
After you set up your events, data columns, and filters, you can begin the trace. Figure 3 shows an example of the type of information captured.
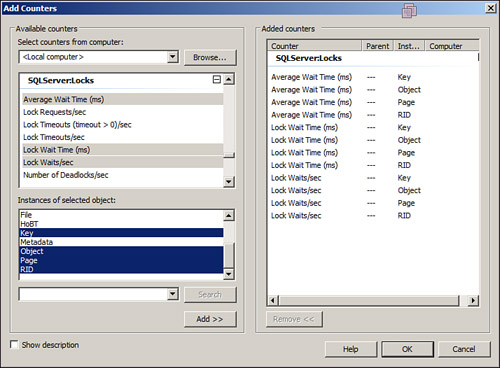
Monitoring Locks with Performance Monitor
Another method of monitoring locking in SQL Server is through the Performance Monitor. The sys.dm_tran_locks
view and SSMS Activity Monitor provide a snapshot of the actual locks
currently in effect in SQL Server. If you want to monitor the locking
activity as a whole on a continuous basis, you can use the Windows
Performance Monitor and monitor the counters available for the SQLServer:Locks performance object (see Figure 4).
Note
If
you are monitoring a SQL Server 2008 named instance rather than a
default instance of SQL Server 2008, the SQL Server performance counters
are listed under the name of the SQL Server instance rather than under
the generic SQLServer performance counters.
You can use the SQLServer:Locks object to
help detect locking bottlenecks and contention points in the system as
well as to provide a summary of the overall locking activity in SQL
Server. You can use the information that Performance Monitor provides to
identify whether locking problems are the cause of any performance
problems. You can then take appropriate corrective actions to improve
concurrency and the overall performance of the system. The counters that
belong to the SQLServer:Locks object are as follows:
Average Wait Time—
This counter represents the average wait time (in milliseconds) for
each lock request. A high value is an indication of locking contention
that could be affecting performance of concurrent processes.
Lock Requests/sec—
This counter represents the total number of new locks and lock
conversion requests made per second. A high value for this counter is
not necessarily a cause for alarm; it might simply indicate a system
with a high number of concurrent users.
Lock Timeouts (timeout > 0)/sec— This counter is similar to the LockTimeouts/sec counter but does not include NOWAIT lock requests that time out immediately.
Lock Timeouts/sec— This
counter represents the total number of lock timeouts per second that
occur for lock requests on a resource that cannot be granted before the
lock timeout interval is exceeded. By default, a blocked process waits
indefinitely unless the application specifies a maximum timeout limit,
using the SET LOCK_TIMEOUT command. A high value for this
counter might indicate that the timeout limit is set to a low value in
the application or that you are experiencing excessive locking
contention.
Lock Wait Time—
This counter represents the cumulative wait time for each lock request.
It is given in milliseconds. A high value here indicates that you might
have long-running or inefficient transactions that are causing blocking
and locking contention.
Lock Waits/sec—
This counter represents the total number of lock requests generated per
second for which a process had to wait before a lock request on a
resource was granted. A high value might indicate inefficient or
long-running transactions or a poor database design that is causing a
large number of transactions to block one another.
Number of Deadlocks/sec—
This number represents the total number of lock requests per second
that resulted in deadlocks.