Excel provides you with no fewer than six
functions to calculate the standard deviation of a set of values, and
it’s pretty easy to get the standard deviation on a worksheet. If the
values you’re concerned with are in cells A2:A21, you might enter this
formula to get the standard deviation:
=STDEV(A2:A21)
The square of a standard deviation is called the variance.
It’s another important measure of the variability in a set of values.
Also, several functions in Excel return the variance of a set of
values. One is VAR(). Again, other versions are discussed later in
“Excel’s Variability Functions.” You enter a formula that uses the
VAR() function just as you enter one that uses a standard deviation
function:
=VAR(A2:A21)
That’s so simple and easy, it might not seem
sensible to take the wraps off a somewhat intimidating formula. But
looking at how the statistic is defined often helps understanding.
Understanding one particular aspect of the variance makes it
much easier to understand the standard deviation.
Here’s what’s often called the definitional formula of the variance:
Here’s the definitional formula in words:
You have a sample of values, where the number of values is represented by N. The letter i
is just an identifier that tells you which one of the N values you’re
using as you work your way through the sample. With those values in
hand, Excel’s standard deviation function takes the following steps.
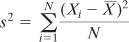
Refer to Figure 1 to see the steps as you might take them in a worksheet, if you wanted to treat Excel as the twenty-first-century equivalent of a Burroughs adding machine.
Note
Different formulas have different names, even when
they are intended to calculate the same quantity. For many years,
statisticians avoided using the definitional formula just shown because
it led to clumsy computations, especially when the raw scores were not
integers. Computational formulas were used instead, and although they
tended to obscure the conceptual aspects of a formula, they made it
much easier to do the actual calculations. Now that we use computers to
do the calculations, yet a different set of algorithms is used. Those
algorithms are intended to improve the accuracy of the calculations far
into the tails of the distributions, where the numbers get so small
that traditional calculation methods yield more approximation than
exactitude.
1. | Calculate the mean of the N values

). In Figure 1, the mean is shown in cell C2. |
2. | Subtract the mean from each of the N values

. These differences (or deviations) appear in cells E2:E21 in Figure 1. |
3. | Square each deviation. See cells G2:G21.
|
4. | Find the total (Σ) of the squared deviations, shown in cell I2.
|
5. | Divide by N to find the mean squared deviation. See cell K2.
|
Step 5 results in the variance. If you think your
way through those steps, you’ll see that the variance is the average
squared deviation from the mean. As we’ve already seen, this quantity
is not intuitively meaningful. You don’t say, for example, that John’s
LDL measure is one variance higher than the mean.
If you wanted to take a sixth step in addition to
the five listed above, you could take the square root of the variance.
Step 6 results in the standard deviation, shown as 21.91 in cell M2 of Figure 1. The Excel formula is =SQRT(K2).
As a check, you find the same value of 21.91 in cell N5 of Figure 1. It’s much easier to enter the formula =STDEVP (A2:A21)
than to go through all the manipulations in the six steps just given.
Nevertheless, it’s a useful exercise to grind it out on the worksheet
even just once, to help you learn and retain the concepts of squaring,
summing, and averaging the deviations from the mean.
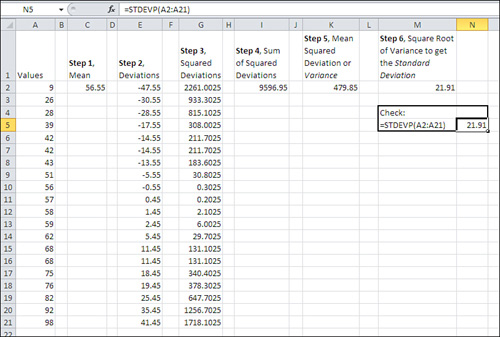
Figure 2 shows the frequency distribution from Figure 1 graphically.
[View full size image]
Notice in Figure 2
that the columns represent the count of records in different sets of
values. A normal distribution is shown as a curve in the figure. The
counts make it clear that this frequency distribution is close to a
normal distribution; however, largely because the number of
observations is so small, the frequencies depart somewhat from the
frequencies that the normal distribution would cause you to expect.
Nevertheless, the standard deviation in this
frequency distribution captures the values in categories that are
roughly equivalent to the normal distribution.
For example, the mean of the distribution is 56.55
and the standard deviation is 21.91. Therefore, a z-score of −1.0 (that
is, one standard deviation below the mean) represents a raw score of
34.64.
If you examine the raw scores in cells A2:A21 in Figure 1,
you’ll see that six of them fall between 34.64 and 56.65. Six is 30% of
the 20 observations, and is a good approximation of the expected 34%.