IT tutorials
 
Office
 

Microsoft Project 2010 : Reviewing the Project-Level Statistics

- Free product key for windows 10
- Free Product Key for Microsoft office 365
- Product Key Free : Microsoft Office 2019 – Serial Number
3/10/2015 9:06:32 PM

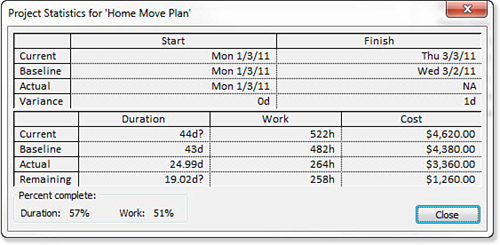
As an element of your confrontation with the reality of program, it is important to thus examine the statistics of level of the project you can see the metric high level one about the program. To make thus, follow these stages:

1.
Select the File tab. In the right-hand pane, click the Project Information drop-down.

2.
Open the Statistics dialog box by selecting Project Statistics. The Project Statistics dialog box is displayed, as shown in Figure 1. Project Statistics displays the baseline, actual, and variance values for your project.

Figure 1. Use the Project Statistics dialog box to review high-level summary information about your project.

Methods of Examining Your Schedule

Take advantage of the tools included in Microsoft Project 2010 to help you examine various aspects of your project. You can use groups, filters, and views to review the parts of your project, as follows:

  • Groups— A very useful feature for organizing items in your schedule based on predefined criteria. To apply groups, select the View tab, Group By.

  • Filters— Enables you to limit what information is displayed in the current view based on the criteria you select. To view all available filters for the selected view, select the View tab, Filter, More Filters.

  • Views— Collections of data that are used to present a certain type of information in a particular way. In addition to the Gantt Chart view, the Resource Usage, Task Usage, and Team Planner views are very useful views for analyzing and finding potential problems with your schedule.

    • Task Usage view shows you each task you have entered into the schedule, with resource assignment information grouped directly under each task. You can review the assignments, when they are scheduled for work, and, if necessary (although not recommended), edit the time-phased resource work data cells. After you edit the work, you may restrict Microsoft Project’s 2010 capability of leveling and moving the resource assignment work.

    • Resource Usage view displays a resource’s scheduled work for your project. This can be useful to get an overall picture of which tasks are assigned to each resource, as they are grouped by resource name. This can be an easy way to determine which tasks have no resources assigned to them. In addition, this view is helpful in reviewing the resource allocations where overloaded resources are highlighted in the color red. You might want to change the timescale to view the allocation on a week-by-week or month-by-month view. To do so, use Format, Timescale to change the formatting settings for the timescale or use the Zoom buttons on the Standard toolbar.

    • The Team Planner view, is entirely new for Project Professional 2010 and can be extremely useful for finding potential problems. You can think of it as a kind of alternate or enhanced Resource Usage view. Unassigned tasks are shown graphically in the lower pane. Unscheduled tasks—a feature of the Manually Scheduled task mode—are listed in the left pane. Overallocations “pile up” graphically in the top-right pane and are highlighted in red. As with the Resource usage view, it is possible to change the timescale or use the zoom controls.

 
Others
 
- Microsoft Project 2010 : Reviewing the Big Picture (Critical Path Analysis)
- Microsoft Project 2010 : Performing a Schedule Reality Check (part 2) - Looking for Technique Errors
- Microsoft Project 2010 : Performing a Schedule Reality Check (part 1) - Looking for Logic Errors, Schedule Estimation Methods
- Microsoft PowerPoint 2010 : Grouping and Changing the Order of Objects - Group and Ungroup Objects
- Microsoft PowerPoint 2010 : Rotating and Flipping Objects
- Microsoft PowerPoint 2010 : Resizing Objects
- Microsoft PowerPoint 2010 : Formatting Objects (part 2) - Change the Shape Outline, Apply a Shape Effect
- Microsoft PowerPoint 2010 : Formatting Objects (part 1) - Apply a Fill Color or Effect
- Microsoft Excel 2010 : Removing Duplicates, Consolidating Data
- Microsoft Excel 2010 : Using the Advanced Filter (part 2) - Filtering a Dataset Using the Advanced Filter, Filtering for Unique Items
 
 
Top 10
 
- Microsoft Visio 2013 : Adding Structure to Your Diagrams - Finding containers and lists in Visio (part 2) - Wireframes,Legends
- Microsoft Visio 2013 : Adding Structure to Your Diagrams - Finding containers and lists in Visio (part 1) - Swimlanes
- Microsoft Visio 2013 : Adding Structure to Your Diagrams - Formatting and sizing lists
- Microsoft Visio 2013 : Adding Structure to Your Diagrams - Adding shapes to lists
- Microsoft Visio 2013 : Adding Structure to Your Diagrams - Sizing containers
- Microsoft Access 2010 : Control Properties and Why to Use Them (part 3) - The Other Properties of a Control
- Microsoft Access 2010 : Control Properties and Why to Use Them (part 2) - The Data Properties of a Control
- Microsoft Access 2010 : Control Properties and Why to Use Them (part 1) - The Format Properties of a Control
- Microsoft Access 2010 : Form Properties and Why Should You Use Them - Working with the Properties Window
- Microsoft Visio 2013 : Using the Organization Chart Wizard with new data
Technology FAQ
- Is possible to just to use a wireless router to extend wireless access to wireless access points?
- Ruby - Insert Struct to MySql
- how to find my Symantec pcAnywhere serial number
- About direct X / Open GL issue
- How to determine eclipse version?
- What SAN cert Exchange 2010 for UM, OA?
- How do I populate a SQL Express table from Excel file?
- code for express check out with Paypal.
- Problem with Templated User Control
- ShellExecute SW_HIDE
programming4us programming4us