2. Monitoring Active Directory Performance with Performance Monitor
As you may have already guessed, the Windows Server
2008 operating system automatically tracks many performance statistics
that are related to Active Directory. You can easily access these same
statistics by using Performance Monitor. The specific counters you'll
want to monitor are part of the NTDS performance object and are based
on several different functions of Active Directory, including some of
those that follow:
The Address Book (AB)
The Directory Replication Agent (DRA)
The Directory Service (DS)
The Lightweight Directory Access Protocol (LDAP)
The Security Accounts Manager (SAM)
You may find each of these performance objects
useful when you are monitoring specific aspects of Active Directory.
The specific counters you choose to monitor will depend on the aspects
of Active Directory performance you're planning to examine. For
example, if you want to measure performance statistics related to
Active Directory replication, you will probably want to monitor
the DRA counters. Similarly, if you're interested in performance loads
generated by Windows NT computers, you will want to monitor the SAM.
Perhaps the best way to learn about the various
types of performance objects, counters, and instances that are related
to Active Directory is by actually measuring these values and saving
them for analysis. Exercise 1
walks you through the steps of working with various features of the
Windows Server 2008 Performance Monitor. In this exercise, you will use
various features of the Windows Server 2008 Performance Monitor to
analyze performance information on a Windows Server 2008 domain
controller.
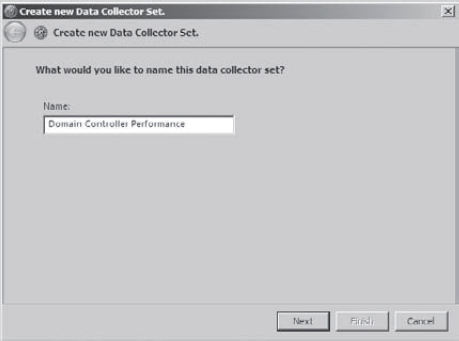
Open the Reliability and Performance Monitor by selecting Start => Run and entering perfmon. In the left pane, right-click Performance Monitor and select New => Data Collector Set. In the Name box of the Create New Data Collector Set dialog box, type Domain Controller Performance and click Next.
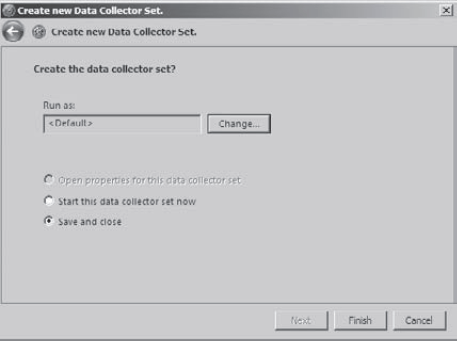
A
dialog box showing the location of the saved data appears. This is the
location on the hard disk where the data will be stored. Keep the
defaults and click Next. In the Create New Data Collector Set dialog box, make sure the Save And Close radio button is selected and click Finish.
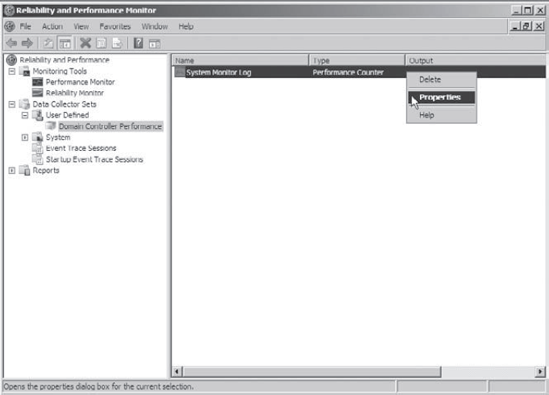
In
the left pane of the Reliability and Performance Monitor, expand Data
Collector Sets, User Defined and click the new collector set you just
created (Domain Controller Performance). Right-click System Monitor Log
in the right pane and choose Properties.
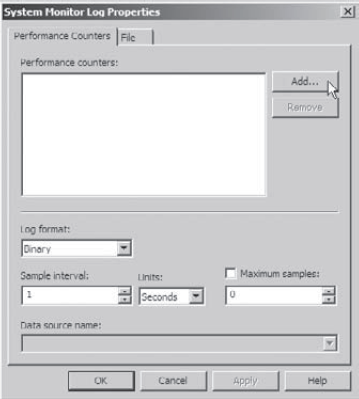
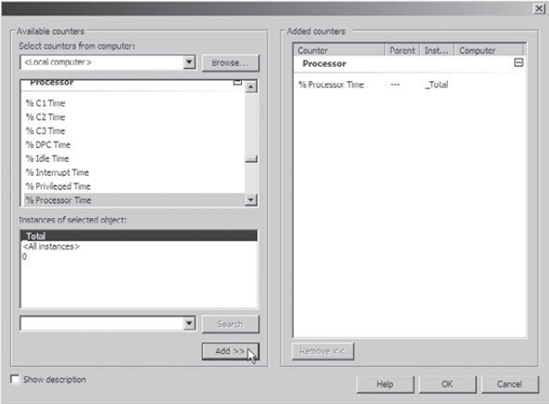
In the System Monitor Log Properties dialog box, click the Add button.
In
the dialog box that appears, select <Local Computer> in the
Select Counters From Computer drop-down list. Expand the Processor
object from the Available Counters list. Select the % Processor Time
counter and the _Total instance. Note that you can click the Show
Description box to find more information about the various parameters
that are available. Click the Add button to add the counter to the
Added Counters list.
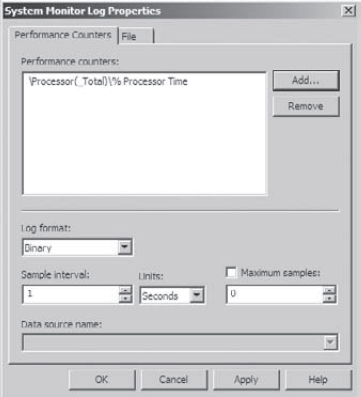
When
you are finished adding these counters, click the OK button to return
to the System Monitor Log Properties dialog box and view the counters
that you selected.
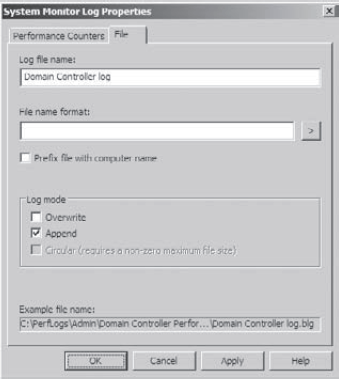
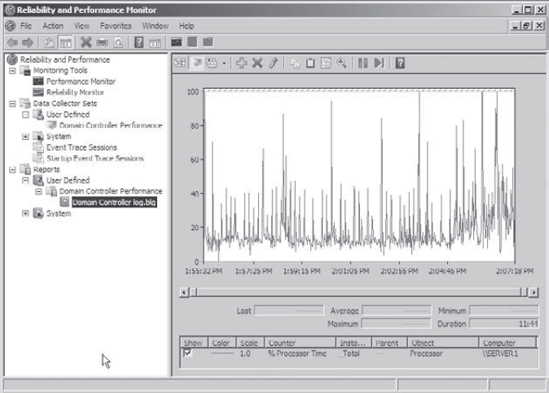
Click the File tab of the System Monitor Log Properties dialog box. Change the log file name to Domain Controller log. Click the Append check box. Click OK.
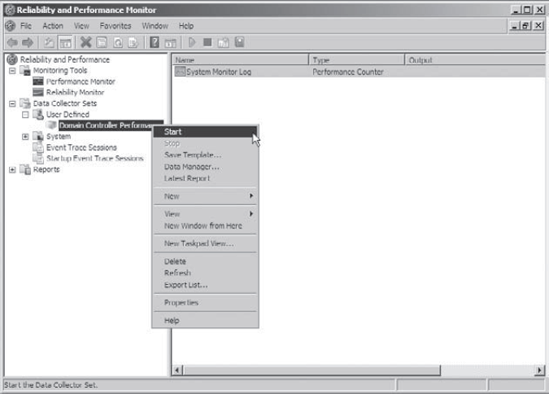
In
the left pane of the Reliability and Performance Monitor, right-click
the collector set Domain Controller Performance. Choose Start.
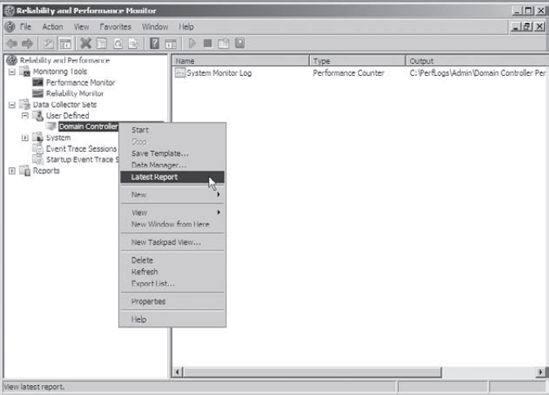
Let
the system run for five minutes. During this time, open applications or
windows on the server. After five minutes, in the left pane of the
Reliability and Performance Monitor, right-click the collector set
Domain Controller Performance. Choose Stop. Right-click the collector set Domain Controller Performance. Choose Latest Report.
View the data that was captured.
When you are done viewing the captured data, close the Reliability and Performance Monitor.
|
It is useful to have a set of performance
monitor counters saved to files so that you can quickly and easily
monitor the items of interest. For example, you may want to create a
System Monitor log that includes statistics related to database
services while another focuses on network utilization. In that way,
whenever a performance problem occurs, you can quickly determine the
cause of the problem (without having to create a System Monitor log
from scratch).