Because performance monitoring and
optimization are vital functions in network environments of any size,
Windows Server 2008 includes several performance-related tools.
The first and most useful tool is the Windows Server 2008 Reliability and Performance Monitor,
which was designed to allow users and systems administrators to monitor
performance statistics for various operating system parameters.
Specifically, you can collect, store, and analyze information about
CPU, memory, disk, and network resources using this tool, and these are
only a handful of the things that you can monitor. By collecting and
analyzing performance values, systems administrators can identify many
potential problems.
Here are the two ways in which you can use the Reliability and Performance Monitor:
Reliability and Performance Monitor ActiveX Control
The Windows Server 2008 Reliability and
Performance Monitor is an ActiveX control that you can place within
other applications. Examples of applications that can host the
Reliability and Performance Monitor control include web browsers and
client programs like Microsoft Office's Word XP or Excel XP. This
functionality can make it very easy for applications developers and
systems administrators to incorporate the Reliability and Performance
Monitor into their own tools and applications.
Reliability and Performance MMC
For more common performance monitoring
functions, you'll want to use the built-in Microsoft Management Console
(MMC) version of the Reliability and Performance Monitor called the
Performance Monitor.
To access the Reliability and Performance Monitor
MMC, you open Computer Management in the Administrative Tools program
group within your Start menu. This launches the Reliability and
Performance MMC and loads and initializes Reliability and Performance
Monitor with a handful of default counters.
You can choose from many different methods of
monitoring performance when you are using Performance Monitor. A couple
of examples are listed here:
You can look at a snapshot of current
activity for a few of the most important counters; this allows you to
find areas of potential bottlenecks and monitor the load on your
servers at a certain point in time.
You
can save information to a log file for historical reporting and later
analysis. This type of information is useful, for example, if you want
to compare the load on your servers from three months ago to the
current load.
You'll get to take a closer look at this method and many others as you examine Performance Monitor in more detail.
In the following sections, you'll learn about the
basics of working with the Windows Server 2008 Performance Monitor and
other performance tools. Then, you'll apply these tools and techniques
when you monitor the performance of Active Directory.
NOTE
Your Performance Monitor grows as your system
grows, and whenever you add services to Windows Server 2008 (such as
installing Exchange Server 2007 SP1), you also add to what you can
monitor. You should make sure that, as you install services, you take a
look at what it is you can monitor.
1. Deciding What to Monitor
The first step in monitoring performance is to decide what
you want to monitor. In Windows Server 2008, the operating system and
related services include hundreds of performance statistics that you
can track easily. All of these performance statistics fall into three
main categories that you can choose to measure:
Performance objects
A performance object within Performance Monitor
is a collection of various performance statistics that you can monitor.
Performance objects are based on various areas of system resources. For
example, there are performance objects for the processor and memory, as
well as for specific services such as web services.
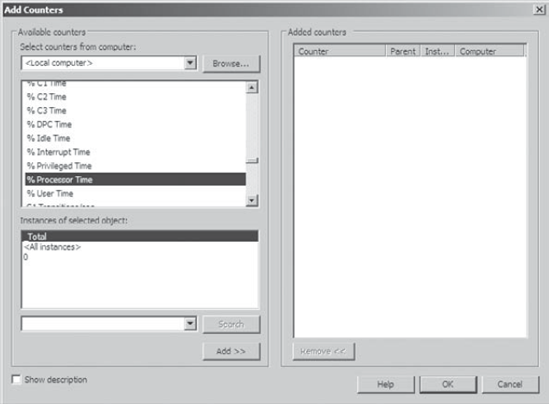
Counters
Counters are the actual parameters measured by
Performance Monitor. They are specific items that are grouped within
performance objects. For example, within the Processor performance
object, there is a counter for % Processor Time. This counter displays
one type of detailed information about the Processor performance object
(specifically, the amount of total CPU time all of the processes on the
system are using).
Instances
Some counters will have instances. An instance
further identifies which performance parameter the counter is
measuring. A simple example is a server with two CPUs. If you decide
that you want to monitor processor usage (using the Processor
performance object)—specifically, utilization (the %Total Utilization
counter)—you must still specify which
CPU(s) you want to measure. In this example, you would choose between
monitoring either of the two CPUs or a total value for both (using the
Total instance).
To specify which performance objects, counters, and
instances you want to monitor, add them to Performance Monitor using
the Add Counters dialog box. Figure 1 shows the various available options when you add new counters to monitor using Performance Monitor.

The items that you will be able to monitor
will be based on your hardware and software configuration. For example,
if you have not installed and configured the Internet Information
Server (IIS) service, the options available within the Web Server
performance object will not be available. Or, if you have multiple
network adapters or CPUs in the server, you will have the option of
viewing each instance separately or as part of the total value.