4. Data compression considerations
In
considering the merits of data compression for a given table or index,
the first and most straightforward consideration is the potential
compression rate.
Compression rate
The
compression rate achieved depends on the underlying data and the
compression method you choose. SQL Server 2008 includes two tools for
estimating disk savings: a Management Studio GUI-based wizard (shown in
figure 3) and the sp_estimate_ data_compression_savings procedure. Let's look at the wizard first.
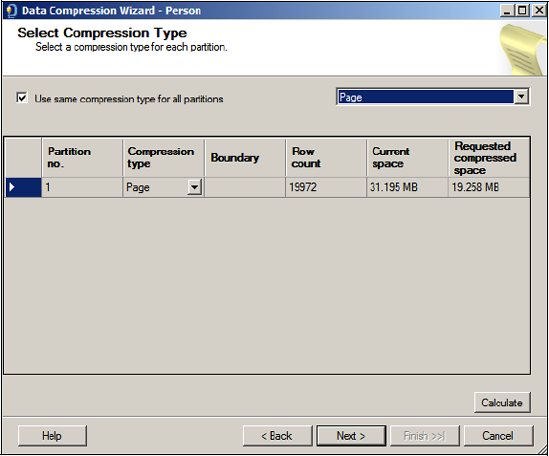
You
can access the wizard by right-clicking a table and choosing Storage
> Manage Compression. The wizard can be used to estimate, script,
and compress the table using the selected compression technique.
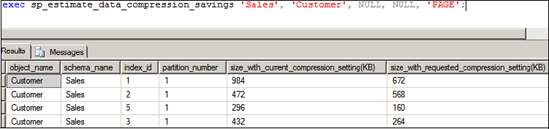
The second tool, the sp_estimate_data_compression_savings procedure, as shown in figure 4,
lists, for a given table and optionally all its indexes, the estimated
size before and after compression. Like the Management Studio wizard,
you can produce estimates for both row and page compression.
Using
the estimate tools as we discussed earlier is an important step in
evaluating the benefits of compression before implementing it. Once you
complete the evaluation, you can implement compression using the same
Management Studio wizard used for estimating the savings.
Alternatively, use the ALTER TABLE statement as shown here:
-- Compress a table using 4 CPUs Only
ALTER TABLE [Sales].[SalesPerson]
REBUILD WITH (DATA_COMPRESSION = PAGE, MAXDOP=4)
One of the nice things about the ALTER TABLE
method of implementing compression is its ability to accept a MAXDOP
value for controlling CPU usage during the initial compression process.
Depending on the size of the table and/or indexes being compressed, CPU
usage may be very high for an extended length of time, so the MAXDOP
setting allows some degree of control in this regard.
Finally,
you should consider the tables and indexes proposed for compression.
Compressing a table that represents a very small percentage of the
overall database size will not yield much of a space gain. Further, if
that same table is used frequently, then the performance overhead may
outweigh the small gain in disk savings. In contrast, a very large
table representing a significant portion of the total database size may
yield a large percentage gain, and if the table is used infrequently,
the gain comes with little performance overhead.
Performance overhead
As
with any compression technique, space savings and increased CPU usage
go hand in hand. On systems close to CPU capacity, the additional
overhead may preclude data compression from being an option. For other
systems, measuring the level of overhead is an important consideration.
The
ideal targets for compression are tables and indexes that are used
infrequently yet represent a significant percentage of the database
size. Targeting such tables minimizes the performance impact while
maximizing disk space savings.
Dynamic management functions and views such as sys.dm_db_index_opera-tional_stats and sys.dm_db_index_usage_stats assist in the process of identifying the least frequently used objects.
For frequently used objects, the performance impact of data compression
needs to be carefully measured in a volume-testing environment capable
of simulating production load.
Despite
the CPU overhead, certain operations such as table scans can actually
receive a performance boost with data compression enabled. Let's have a
look at two examples of both the positive and negative performance
impacts of data compression. In viewing these examples, keep in mind
that the results of any tests such as these are very much dependent on
the makeup of the underlying data. These tests were conducted on
modified versions of the tables in the AdventureWorks sample database.
Results from real-world customer databases will obviously vary.
The
first example tests the time taken to insert the contents of a modified
version of the AdventureWorks SalesOrder_Detail table containing 1.6
million records into a blank table with the same structure. The insert
was repeated multiple times to observe the insert time and resultant
table size with both page and row compression enabled. For comparison
purposes, we also ran the test against an uncompressed table.
-- Measure the size and execution time of various compression settings
TRUNCATE TABLE [Sales].[SalesOrder_Detail_Copy];
GO

ALTER TABLE [Sales].[SalesOrder_Detail_Copy]
REBUILD WITH (DATA_COMPRESSION = PAGE) -- repeat for ROW, NONE
GO

INSERT [Sales].[SalesOrder_Detail_Copy]
SELECT *
FROM [Sales].[SalesOrder_Detail];
GO
Rather than execute DBCC DROPCLEANBUFFERS
between executions to clear the buffer cache, each test was run
multiple times to ensure the data to insert was cached in memory for
all three tests. This method lets you more accurately compare the
relative performance differences between the compression methods by
narrowing the focus to the time taken to write the new rows to disk.
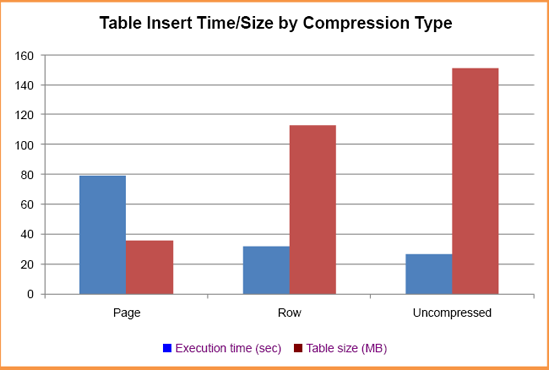
The results of the three tests, shown in figure 5,
clearly indicate higher compression rates for page compression over row
compression, but at a correspondingly higher cost in terms of execution
time.
Performance increase
Despite
the CPU overhead required to compress and uncompress data, in certain
cases compressed data can actually boost performance. This is
particularly evident in disk I/O bound range scans. If the data is
compressed on disk, it follows that fewer pages will need to be read
from disk into memory—which translates to a performance boost. Let's
use another example to demonstrate.
In
this example, we'll select the average unit price from the
Sales.SalesOrder_Detail_Copy table. Again, this table was modified for
the purposes of the test. For this example, the table was increased in
size to 6.7 million rows. Given that the UnitPrice field isn't indexed,
a full table scan will result, which is ideal for our test. We'll run
this three times, on an uncompressed table, and with both forms of
compression enabled. For this test, we'll clear the buffer cache with DBCC DROPCLEANBUFFERS before each test to ensure the query reads from disk each time. The script used for this test looks like this:
-- Measure the table scan time of various compression settings
ALTER TABLE [Sales].[SalesOrder_Detail_Copy]
REBUILD WITH (DATA_COMPRESSION = ROW) -- repeat for PAGE, NONE
GO

DBCC DROPCLEANBUFFERS;
GO

SELECT AVG(UnitPrice)
FROM Sales.SalesOrder_Detail_Copy;GO
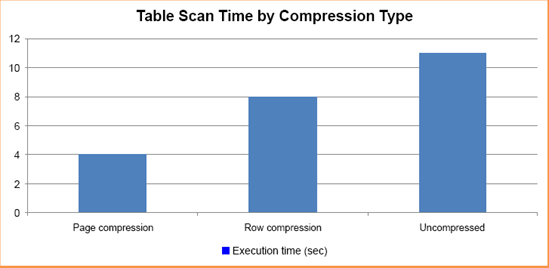
The results of the three tests, shown in figure 6,
clearly indicate that page compression enables the fastest execution
time for this particular example—almost three times quicker than the
query against the uncompressed table.