During troubleshooting, there are some steps that
should be the same no matter what the symptoms are. Yes, you need to
define the problem, as discussed earlier, and you also need to
understand the scope of the issue. But once you've determined that the
problem is indeed server based rather than specific to a group of
clients, what next? This section will focus on the key tools you should
use first.
1. Event Viewer (Diagnostic Logging)
Troubleshooting a server involves data collection
and analysis, and the best ways to collect that data are the same
regardless of server role. The Event Viewer includes detailed
information about recent system and application errors, and this should
always be an administrator's first move in the event of crisis. Once
you've determined the scope of a problem, and you've positively
identified the root cause as server related, your next step should be
to check the event logs on the relevant system. Because Exchange has so
many moving parts, so to speak, you'll often find a large number of
events clustered together at the time of the reported issue. The
default logging level for the majority of services and categories is
Lowest, which means that only critical, error, and warnings of logging
level 0 will be written to the event log.
If the events generated during the problem aren't
quite enough, you might need to increase the logging level for a
specific service and category—for example, MSExchange Transport\Mail Submission—to
Low, Medium, or High. There is another logging level, Expert, but this
generates so many events that it should only be used for short periods,
typically when working directly with Microsoft support.
As with nearly everything in Exchange Server 2010,
you can configure diagnostic logging through either the Exchange
Management Console (EMC) or the Exchange Management Shell (EMS).
|
In the initial release of Exchange Server 2007,
diagnostic logging was removed from the EMC, and the only way you could
increase logging for a particular service was by using the Set-EventLogLevel
cmdlet. Since PowerShell was still new at the time (Exchange Server
2007 was many administrators' first exposure to it), the change wasn't
well received, and so Microsoft reintroduced diagnostic logging control
to the console in Service Pack 2.
|
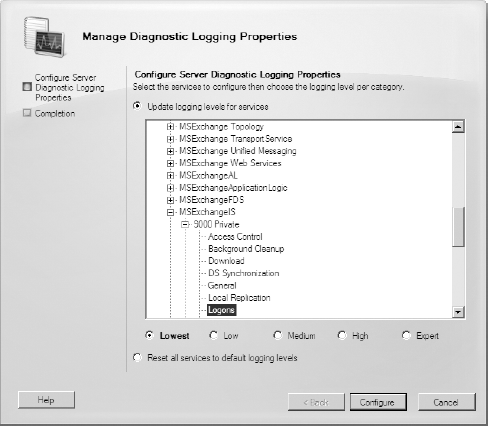
The Manage Diagnostic Logging Properties wizard (shown in Figure 1)
is available from the Server Configuration node. Select the server
role, then the server, and click Manage Diagnostic Logging Properties
in the Actions pane. This launches the wizard, which allows you to
select one or more services to modify.

Configuring diagnostic logging with the EMS is a little trickier, because although Get-EventLogLevel (which retrieves logging information) can be used remotely, Set-EventLogLevel does not
take a server parameter. In other words, you have to run the command
from the shell on the target server to configure logging. The syntax is
relatively straightforward:
Set-EventLogLevel –Identity "MSExchange Transport\Mail Submission"
–Level Medium
It's always a good idea to reset the logging back to
Lowest when you're done troubleshooting. Increased logging can add
significantly to event log growth, and depending on your settings it
might fill up your event log quickly or overwrite events.
Once you've identified the target server and
configured logging, you might not see relevant events right away. You
may need to reproduce the issue (for example, by having the user send
another email or attempt to force a connection for a mail queue) before
Exchange logs anything of value. Exchange events themselves will always
appear in the Application event log, although some dependencies
(clustering, network, disk drives, and so forth) will log their
information to the System event log.
Diagnostic events include a wealth of information, but the most important pieces are the following:
Description
Although the field is unnamed in Windows Server
2008, it's the equivalent of the legacy Description field from previous
versions of Windows. This includes the text of the event, and will in
many cases include additional error codes or critical information. For
example, the well-known and widely feared "-1018 error" isn't an
event—it's a JET error code that appears within the description text of
other ESE events, like ESE error 474. The description may also include
a link to further information on the Microsoft support site.
Source
This tells you which component logged the event.
Note that this will typically be the underlying service name rather
than the "friendly" name, so expect to see MSExchangeIS rather than
Microsoft Exchange Information Store.
Event ID
This is the specific event number. Along with the Source, this is the most important information for the event.
Level
This reflects the severity of the event, and can range from Informational to Error.
Logged
This displays the date and time the event,
displayed in local time. This information is stored in the event in
UTC, and the Event Viewer displays the equivalent local time—if you're
looking at a remote server, make sure you take this into account!
Task Category
This is the subcomponent of the service that
logged the event. Not all services will provide this additional
information, but the majority of Exchange services do. This corresponds
to the categories visible in the Manage Diagnostic Logging Properties
wizard or via Set-EventLogLevel.
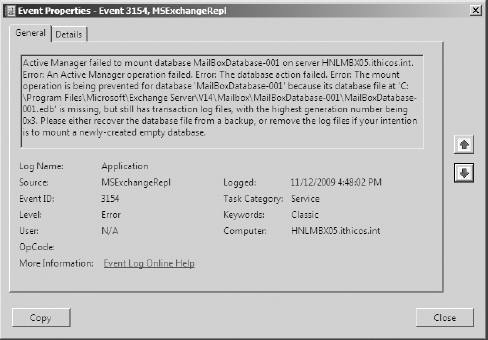
Depending on the error, you should see something similar to the event shown in Figure 2.
Many Exchange events include detailed diagnostic
steps in the Description field, which is extremely convenient in times
of trouble. Even if the event doesn't provide too much information, you
might be able to find more information on the TechNet Events and Errors
Message Center at www.microsoft.com/technet/support/ee/eeadvanced.aspx.
Simply select the appropriate product (Exchange, obviously); select the
appropriate version (14.0 for Exchange Server 2010); enter the event
ID, source, or both; and then click Go. Assuming the event appears in
the TechNet database, you should see a link for additional information,
which then provides a detailed explanation of the issue as well as
troubleshooting steps and recommendations. If you can't find
information on the specific event here, there's always the Microsoft
Knowledge Base (http://support.microsoft.com/search/?adv=1) or your favorite search engine.
2. Test-SystemHealth
PowerShell cmdlets control so much functionality in
Exchange Server 2010 that it's not a surprise to see troubleshooting
cmdlets as well. One of the most basic is Test-SystemHealth,
a handy little tool that quickly collects data about the local server
and analyzes it according to Microsoft-recommended practices. The
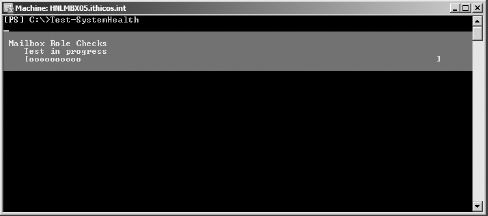
standard syntax is mercifully simple: type Test-SystemHealth, press Enter, and then wait for the output. Unlike many cmdlets, Test-SystemHealth
generates a progress bar at the top of the EMS window. This is a useful
visual indicator—it's high contrast so you can see it from several feet
away

When the cmdlet finishes, it displays the results in a simple list format (which you could format with the Format-List cmdlet if you wanted to), as shown in Figure 3.

As you can see in the output, the resulting data is
a mini-health check for your server. The Test-SystemHealth cmdlet will
alert you to many common misconfigurations as well as recommended
settings.