SQL
Server Profiler serves as another powerful tool available for query
analysis. When you must monitor a broad range of queries and database
activity and analyze the performance, it is difficult to analyze all
those queries manually. For example, if you have a number of stored
procedures to analyze, how would you know which ones to focus on as
problem procedures? You would have to identify sample parameters for all
of them and manually execute them individually to see which ones were
running too slowly and then, after they were identified, do some query
analysis on them.
With SQL Server Profiler, you
can simply define a trace to capture performance-related statistics on
the fly while the system is being used normally. This way, you can
capture a representative sample of the type of activity your database
will receive and capture statistics for the stored procedures as they
are being executed with real data values. Also, to avoid having to look
at everything, you can set a filter on the Duration column so that it
displays only items with a runtime longer than the specified threshold.
The events you want to capture
to analyze query performance are listed under the Performance events.
They include Showplan All, Showplan Statistics Profile, Showplan Text,
Showplan Text (Unencoded), Showplan XML, Showplan XML for Query Compile,
and Showplan XML Statistics Profile. The data columns that you want to
be sure to include when capturing the showplan events are TextData, CPU,
StartTime, Duration, and Reads and Writes. Also, for the Showplan
Statistics and Showplan All events, you must also select the BinaryData
data column.
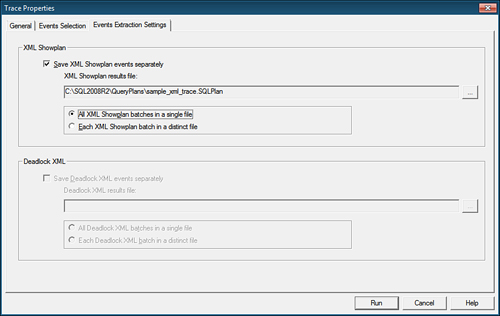
You can easily save the trace information to
a file or table for replaying the sequence to test index or
configuration changes, or simply for historical analysis. If you choose
any of the Showplan XML options, you have the option of saving the XML
Showplan events separately from the overall trace file. You can choose
to save all XML Showplan events in a single file or separate file for
each event (see Figure 1). You can then load the Showplan XML file into SSMS to view the graphical execution plans and perform your query analysis.
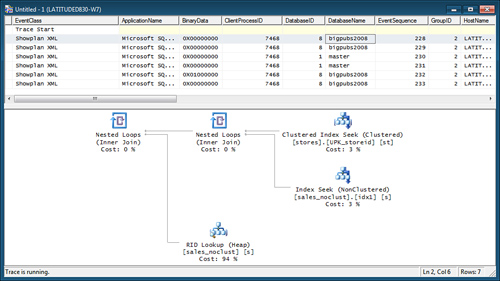
When you run a SQL Server
Profiler trace with the Showplan XML event enabled, SQL Server Profiler
displays the graphical execution plans captured in the bottom display
panel of the Profiler window when you select a record with a Showplan
XML EventClass. The graphical execution plans displayed in SQL Server
Profiler are just like the ones displayed in SSMS, and they also include
the same detailed information available via the ToolTips. Figure 2 shows an example of a graphical execution plan being displayed in SQL Server Profiler.
Note
Because
of the capability to view the graphical execution plans in SQL Server
Profiler as well as the capability to save the XML Showplan events to a
separate file, which you can bring into SSMS for analysis, the XML
Showplan events provide a significant benefit over the other,
older-style showplan events provided. As a matter of fact, these other
showplan events are provided primarily for backward-compatibility
purposes. In a future version of SQL Server, the Showplan All, Showplan
Statistics Profile, Showplan Text, and Showplan Text (Unencoded) event
classes will be deprecated. It is recommended that you switch to using
the newer XML event classes instead.