IT tutorials
 
Office
 

Microsoft Access 2010 : Enhancing the Queries That You Build - Using Aggregate Functions to Summarize Numeric Data

- Free product key for windows 10
- Free Product Key for Microsoft office 365
- Product Key Free : Microsoft Office 2019 – Serial Number
12/5/2014 3:31:10 AM

By using aggregate functions, you can easily summarize numeric data. You can use aggregate functions to calculate the sum, average, count, minimum, maximum, and other types of summary calculations for the data in a query result. These queries let you calculate one value for all the records in a query result or group the 
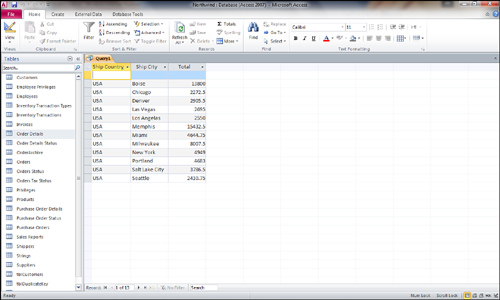
calculations as desired. For example, you could determine the total sales for every record in the query result, as shown in Figure 2, or you could output the total sales by ship country/region and ship city, as shown in Figure 1. You could also calculate the total, average, minimum, and maximum sales amounts for all customers in the United States. The possibilities are endless.

Figure 1. Total sales for every record in a query result.

Figure 2. Total sales by Ship Country/Region and Ship City.
 
Others
 
- Microsoft Project 2010 : Setting Up Project for Your Use - Defining Custom Fields
- Microsoft Project 2010 : Setting Up Project for Your Use - Defining Calendars (part 2) - Setting Project and Resources Calendar
- Microsoft Project 2010 : Setting Up Project for Your Use - Defining Calendars (part 1) - Calendar Hierarchy , Modifying and Defining Base Calendars
- Microsoft Visio 2013 : Creating a New Diagram - Connecting shapes with lines
- Microsoft Visio 2013 : Creating a New Diagram - Resizing and repositioning shapes
- Microsoft PowerPoint 2010 : Working with Charts - Modifying and Formatting Charts (part 3) - Formatting Charts
- Microsoft PowerPoint 2010 : Working with Charts - Modifying and Formatting Charts (part 2) - Modifying Your Chart’s Layout
- Microsoft PowerPoint 2010 : Working with Charts - Modifying and Formatting Charts (part 1) - Modifying Chart Design
- Microsoft PowerPoint 2010 : Working with Charts - Inserting a Chart from Excel
- Microsoft PowerPoint 2010 : Working with Charts - Inserting Charts
 
 
Top 10
 
- Microsoft Visio 2013 : Adding Structure to Your Diagrams - Finding containers and lists in Visio (part 2) - Wireframes,Legends
- Microsoft Visio 2013 : Adding Structure to Your Diagrams - Finding containers and lists in Visio (part 1) - Swimlanes
- Microsoft Visio 2013 : Adding Structure to Your Diagrams - Formatting and sizing lists
- Microsoft Visio 2013 : Adding Structure to Your Diagrams - Adding shapes to lists
- Microsoft Visio 2013 : Adding Structure to Your Diagrams - Sizing containers
- Microsoft Access 2010 : Control Properties and Why to Use Them (part 3) - The Other Properties of a Control
- Microsoft Access 2010 : Control Properties and Why to Use Them (part 2) - The Data Properties of a Control
- Microsoft Access 2010 : Control Properties and Why to Use Them (part 1) - The Format Properties of a Control
- Microsoft Access 2010 : Form Properties and Why Should You Use Them - Working with the Properties Window
- Microsoft Visio 2013 : Using the Organization Chart Wizard with new data
Technology FAQ
- Is possible to just to use a wireless router to extend wireless access to wireless access points?
- Ruby - Insert Struct to MySql
- how to find my Symantec pcAnywhere serial number
- About direct X / Open GL issue
- How to determine eclipse version?
- What SAN cert Exchange 2010 for UM, OA?
- How do I populate a SQL Express table from Excel file?
- code for express check out with Paypal.
- Problem with Templated User Control
- ShellExecute SW_HIDE
programming4us programming4us