Squaring the Deviations
Why square each deviation and then take the square
root of their total? One primary reason is that if you simply take the
average deviation, the result is always zero. Suppose you have
three values: 8, 5, and 2. Their average value is 5. The deviations are
3, 0, and −3. The deviations total to zero, and therefore the mean of
the deviations must equal zero. The same is true of any set of real
numbers you might choose.
Because the total deviation is always zero,
regardless of the values involved, it’s useless as an indicator of the
amount of variability in a set of values. Therefore, each deviation is
squared before totaling them. Because the square of any number is
positive, you avoid the problem of always getting zero for the total of
the deviations.
It is possible, of course, to use the absolute value
of the deviations: that is, treat each deviation as a positive number.
Then the sum of the deviations must be a positive number, just as is
the sum of the squared deviations. And in fact there are some who argue
that this figure, called the mean deviation, is a better way to calculate the variability in a set of values than the standard deviation.
Population Parameters and Sample Statistics
You normally use the word parameter for a number that describes a population and statistic for a number that describes a sample. So the mean of a population is a parameter, and the mean of a sample is a statistic.
It’s traditional
to use Greek letters for parameters that describe a population and to
use Roman letters for statistics that describe a sample. So, you use
the letter s to refer to the standard deviation of a sample and σ to refer to the standard deviation of a population.
With those conventions in mind—that is, Greek
letters to represent population parameters and Roman letters to
represent sample statistics—the equation that defines the variance for
a sample that was given above should read differently for the variance
of a population. The variance as a parameter is defined in this way:
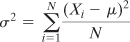
The equation shown here is functionally identical to
the equation for the sample variance given earlier. This equation uses
the Greek σ, pronounced sigma. The lowercase σ is the symbol used in statistics to represent the standard deviation of a population, and σ2 to represent the population variance.
The equation also uses the symbol μ. The Greek letter, pronounced mew, represents the population mean, whereas the symbol
 , pronounced X bar,
represents the sample mean. (It’s usually, but not always, related
Greek and Roman letters that represent the population parameter and the
associated sample statistic.)
, pronounced X bar,
represents the sample mean. (It’s usually, but not always, related
Greek and Roman letters that represent the population parameter and the
associated sample statistic.)
The symbol for the number of values, N, is not replaced. It is considered neither a statistic nor a parameter.
Another issue is involved with the formula that
calculates the variance (and therefore the standard deviation). It
stays involved when you want to estimate the variance of a population
by means of the variance of a sample from that population. I
Suppose now that you have a sample of 100 piston
rings taken from a population of, say, 10,000 rings that your company
has manufactured. You have a measure of the diameter of each ring in
your sample, and you calculate the variance of the rings using the
definitional formula:
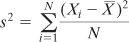
You’ll get an accurate value for the variance in the sample, but that value is likely to underestimate
the variance in the population of 10,000 rings. In turn, if you take
the square root of the variance to obtain the standard deviation as an
estimate of the population’s standard deviation, the underestimate
comes along for the ride.
Samples involve error: in practice, their statistics
are virtually never precisely equal to the parameters they’re meant to
estimate. If you calculate the mean age of ten people in a statistics
class that has 30 students, it is almost certain that the mean age of
the ten student sample will be different from the mean age of the 30
student class.
Similarly, it is very likely that the mean piston
ring diameter in your sample is different, even if only slightly, from
the mean diameter of your population of 10,000 piston rings. Your
sample mean is calculated on the basis of the 100 rings in your sample.
Therefore, the result of the calculation

which uses the sample mean
 , is different from, and smaller than, the result of this calculation:

which uses the population mean μ.
Bear in mind that when you calculate deviations using the mean of the sample’s
observations, you minimize the sum of the squared deviations from the
sample mean. If you use any other number, such as the population mean,
the result will be different from, and larger than, when you use the
sample mean.
Therefore, any time you estimate the variance (or
the standard deviation) of a population using the variance (or standard
deviation) of a sample, your statistic is virtually certain to
underestimate the size of the population parameter.
There would be no problem if your sample mean
happened to be the same as the population mean, but in any meaningful
situation that’s wildly unlikely to happen.
Is there some correction factor that can be used to
compensate for the underestimate? Yes, there is. You would use this
formula to accurately calculate the variance in a sample:

But if you want to estimate the value of the variance of the population from which you took your sample, you divide by N − 1:

The quantity (N − 1) in this formula is called the degrees of freedom.
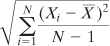
Similarly, this formula is the definitional formula
to estimate a population’s standard deviation on the basis of the
observations in a sample (it’s just the square root of the sample
estimate of the population variance):
If you look into the documentation for Excel’s
variance functions, you’ll see that VAR() or, in Excel 2010, VAR.S() is
recommended if you want to estimate a population variance from a
sample. Those functions use the degrees of freedom in their
denominators.
The functions VARP() and, in Excel 2010, VAR.P() are
recommended if you are calculating the variance of a population by
supplying the entire population’s values as the argument to the
function. Equivalently, if you do have a sample from a population but
do not intend to infer the population variance—that is, you just want
to know the sample’s variance—you would use VARP() or VAR.P(). These
functions use N, not the N − 1 degrees of freedom, in their
denominators.
The same is true of STDEVP() and STDEV.P(). Use them
to get the standard deviation of a population or of a sample when you
don’t intend to infer the population’s standard deviation. Use STDEV()
or STDEV.S() to infer a population standard deviation.