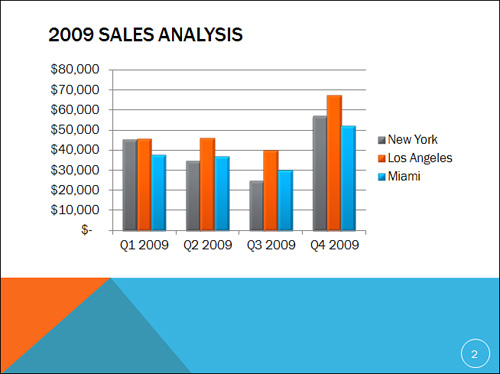
Charts enable you to display, analyze, and compare
numerical data in a graphical format. For example, you can use a column
chart to compare sales revenue by region over a period of time (see Figure 1).
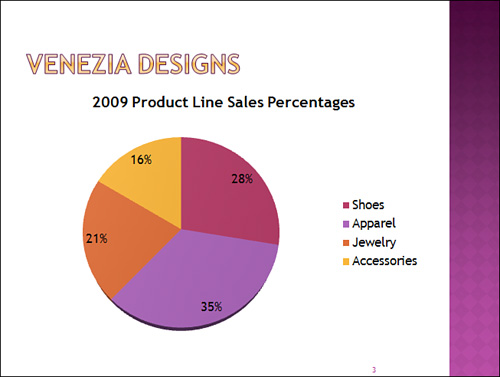
Or you can create a pie chart that illustrates the percentage of
revenue each of your product lines contributes to your total company
revenue (see Figure 2).
PowerPoint also offers a vast array of design and
formatting options to make your charts as aesthetically pleasing as
they are informational, giving your presentation the wow factor.
PowerPoint 2010 uses the worksheet and charting
tools available in Excel 2010 to create charts. When you insert a
chart, a separate Excel window opens where you enter data that
PowerPoint then uses to create a chart. Note that you must have Excel
installed for this feature to work properly. You can also create a
chart directly in Excel and insert it into your presentation.
Understanding Chart Terminology
Before creating a chart, it’s a good idea to learn—or refresh your memory about—basic chart terminology. Table 1 lists the basic concepts you need to understand to make the most of PowerPoint chart functionality.
Table 1. Chart Terminology
| Term | Definition |
|---|
| Axis | A
line defining the chart area. PowerPoint charts have two axes: a
vertical axis that displays data (the y-axis) and a horizontal axis
that displays categories (the x-axis). |
| Chart area | The entire chart and all its components. |
| Data label | A label that provides information about a data marker. |
| Data points | Values that display on a chart in the form of columns, bars, or pie slices, for example. A data marker represents each individual data point. |
| Data series | A group of related data points on a chart, identified by a specific color or pattern. |
| Legend | A small box that describes the patterns or colors used to distinguish chart data series or categories. |
| Plot area | The area of the chart included inside the axes. |
Understanding Chart Types
PowerPoint offers multiple chart types, each with
several variations to choose from. For example, if you want to create a
column chart, PowerPoint offers 19 different variations of the basic
column chart, including options for creating 3-D, clustered, pyramid,
and cone column charts.
|
The total number of chart types—more than 70 in
all—can become overwhelming. To choose the right chart type, think
carefully about the information you want to present and the message you
want to convey with this data, and then select a chart type suited to
your data. From there, choose the variation that provides the optimal
visual impact and works well with your PowerPoint theme. If you don’t
have a lot of experience creating charts, you might need to experiment
to find just the right match.
|
Table 2 lists PowerPoint chart types.
Table 2. PowerPoint Chart Types
| Chart Type | Description |
|---|
| Column | Compare
data in two or more vertical columns. This chart type works well if you
want to compare categories or data across a specific time span. |
| Line | Display data across a line with markers for each value. |
| Pie | Display a round pie-shaped chart with percentages of a total. |
| Bar | Compare data in two or more horizontal bars. |
| Area | Display value trends in a single area. |
| X Y (Scatter) | Compare data with lines and markers. |
| Stock | Display stock data (or other scientific data) in terms of volume and open, high, low, and close value. |
| Surface | Display numeric data in 3-D columns and rows. |
| Doughnut | Display a round pie-shaped chart that can include multiple series of data. |
| Bubble | Display x and y values in columns with an additional value appearing as a bubble. |
| Radar | Compare the value of several series of data. |