Analyzing Data Using a PivotTable or PivotChart
When you want to summarize information in a lengthy list using complex criteria, use the PivotTable
to simplify your task. Without the PivotTable, you would have to
manually count or create a formula to calculate which records met
certain criteria, and then create a table to display that information.
You can use the PivotTable layout to determine what fields and criteria
you want to use to summarize the data and how you want the resulting
table to look. Sometimes a PivotTable is hard to read. To help you
present PivotTable data, you can create a chart. A chart of a PivotTable
is called a PivotChart.
Create a PivotTable or PivotChart Report
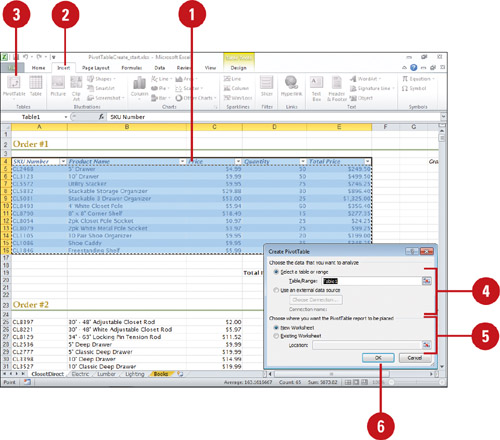
 Click anywhere within the table range, or select a range of cells.
 Click the Insert tab.
 Click the PivotTable button arrow, and then click PivotTable, or PivotChart.
 Click the Select a table or range option, or click the Use an external data source option, click Choose Connection, and then select a connection.
 Click the New worksheet option or Existing worksheet option, and specify a cell range.
 Click OK.
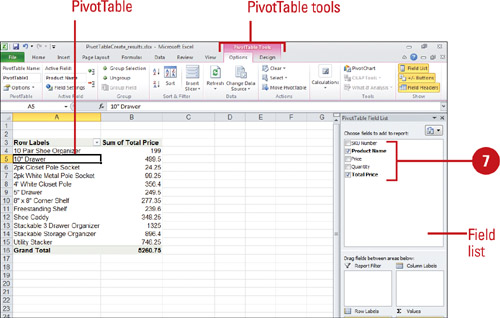
The Options and Design tab under PivotTable Tools appears.
 Select the check boxes next to the fields you want to use to add them
to the empty PivotTable. As you create or modify a PivotTable, Excel
updates the PivotChart.
Select the check boxes next to the fields you want to use to add them
to the empty PivotTable. As you create or modify a PivotTable, Excel
updates the PivotChart.
You can delete a PivotTable. Click the PivotTable report, click the Options tab, click the Select button, click Entire PivotTable, and then press Delete.
Updating a PivotTable or PivotChart
You
can quickly update a PivotTable report using the PivotTable Field List
or the Options tab under PivotTable Tools, which appears whenever a
PivotTable is active. This saves you from having to recreate a
PivotTable every time you add new data to a list. When you do want to
add or remove data to and from a PivotTable or PivotChart, Excel makes
it easy by allowing you to select or clear field check boxes.
Add or Remove a Field in a PivotTable or PivotChart Report
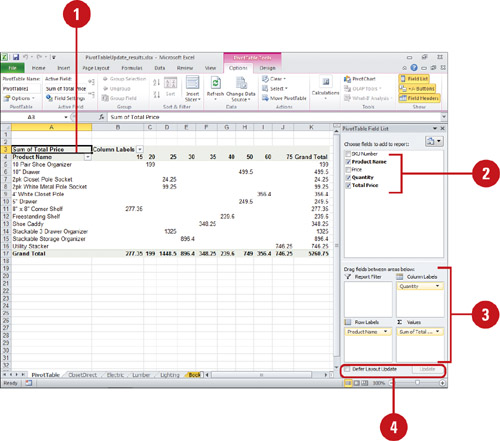
- Click any field in the PivotTable report.
- Select or clear the check boxes next to the fields you want to include or exclude from the PivotTable and PivotChart.
- To change the position of a field, drag the field in the Field list to another one of the following boxes:
- Values. Use to display summary numeric data.
- Row Labels. Use to display fields as rows on the side of the report. Axis field in a PivotChart.
- Column Labels. Use to display fields as columns at the top of the report. Legend field in a PivotChart.
- Report Filter. Use to filter the entire report based on the selected item in the report filter.
Timesaver
Right-click a field in the Field list to access move and other related field commands.
- To enable manual layout updating, select the Defer layout update check box. Click Update to manually update the report layout.
You can select a
different data source for a PivotTable. Click the PivotTable report,
click the Options tab, click the Change Data Source button, click the
Select A Table Or Range option and specify a range, or click the Use An
External Data Source option and specify a connection, and then click OK.
You can refresh PivotTable or PivotChart data. Click the PivotTable
report, click the Options tab, and then click the Refresh button. Click
the PivotChart report, click the Analyze tab, and then click the Refresh
button.