IT tutorials
 
Office
 

Microsoft PowerPoint 2010 : Working with Charts - Inserting Charts

- Free product key for windows 10
- Free Product Key for Microsoft office 365
- Product Key Free : Microsoft Office 2019 – Serial Number
11/19/2014 8:27:23 PM
The fastest way to add a chart to your presentation is to apply a slide layout that contains the content palette.

Inserting a Chart

To insert a chart, follow these steps:

1.
Click the down arrow below the New slide button on the Home tab, and then choose an appropriate layout from the gallery that displays. For example, you can choose the Title and Content layout, the Two Content layout, or the Content with Caption layout.

2.
On your new slide, click the Insert Chart button on the content palette, as shown in Figure 1. The Insert Chart dialog box opens (see Figure 2).

Figure 1. Click the Insert Chart button to start.


Figure 2. Choose from a variety of chart types.

Another way to insert a chart is to click the Chart button on the Insert tab.


3.
In the Insert Chart dialog box, select the button for the chart type you want to insert. Or scroll the contents of the Insert Chart dialog box to view all options.

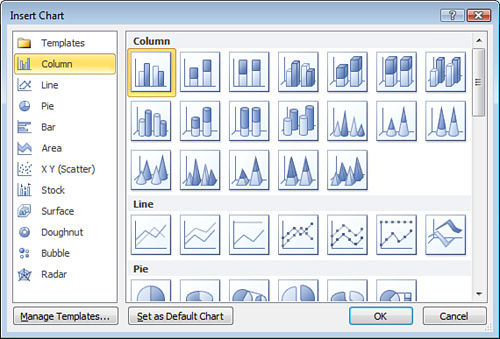
You can also view any chart templates you’ve saved by clicking the Templates button. In the Insert Chart dialog box, you can also click the Manage Templates button to open the Charts window, where you can rename and delete your saved charts.


4.
Select the icon for the specific chart type you want to insert, and click the OK button. The chart appears on your slide. In addition, Excel opens in another window with sample data in the format needed for the selected chart type (see Figure 3).


Figure 3. Excel opens in another window where you can edit your chart data.

If you use the same chart type on a frequent basis, click the Set as Default Chart button to select this chart type by default every time you open the Insert Chart dialog box.


5.
Click the Maximize button in the upper-right corner of Excel to maximize the Excel worksheet where you can enter the data for your selected chart type.

6.
Replace the sample data that displays in Excel (refer to Figure 3) with your actual data. The format of the sample data varies based on the chart type you selected in the Insert Chart dialog box. Note that any text formatting you apply in Excel, such as bolding or cell styles, doesn’t carry over to PowerPoint, but number formatting such as changing regular numbers to dollar amounts does carry over.

7.
Return to the PowerPoint window to view and format your chart.
 
Others
 
- Microsoft PowerPoint 2010 : Working with Charts - Understanding Charts
- Microsoft Visio 2013 : Creating a New Diagram - Positioning shapes with rulers and guides
- Microsoft Visio 2013 : Creating a New Diagram - Copying, pasting, and duplicating shapes
- Microsoft Visio 2013 : Creating a New Diagram - Selecting shapes
- Microsoft Visio 2013 : Creating a New Diagram - Using basic shapes and the Dynamic Grid
- Microsoft Accesss 2010 : Enhancing the Queries That You Build - Creating and Running Action Queries (part 4) - Creating and Running Make Table Queries
- Microsoft Accesss 2010 : Enhancing the Queries That You Build - Creating and Running Action Queries (part 3) - Creating and Running Append Queries
- Microsoft Accesss 2010 : Enhancing the Queries That You Build - Creating and Running Action Queries (part 2) - Creating and Running Delete Queries
- Microsoft Accesss 2010 : Enhancing the Queries That You Build - Creating and Running Action Queries (part 1) - Creating and Running Update Queries
- Microsoft Accesss 2010 : Enhancing the Queries That You Build - Creating and Running Parameter Queries
 
 
Top 10
 
- Microsoft Visio 2013 : Adding Structure to Your Diagrams - Finding containers and lists in Visio (part 2) - Wireframes,Legends
- Microsoft Visio 2013 : Adding Structure to Your Diagrams - Finding containers and lists in Visio (part 1) - Swimlanes
- Microsoft Visio 2013 : Adding Structure to Your Diagrams - Formatting and sizing lists
- Microsoft Visio 2013 : Adding Structure to Your Diagrams - Adding shapes to lists
- Microsoft Visio 2013 : Adding Structure to Your Diagrams - Sizing containers
- Microsoft Access 2010 : Control Properties and Why to Use Them (part 3) - The Other Properties of a Control
- Microsoft Access 2010 : Control Properties and Why to Use Them (part 2) - The Data Properties of a Control
- Microsoft Access 2010 : Control Properties and Why to Use Them (part 1) - The Format Properties of a Control
- Microsoft Access 2010 : Form Properties and Why Should You Use Them - Working with the Properties Window
- Microsoft Visio 2013 : Using the Organization Chart Wizard with new data
Technology FAQ
- Is possible to just to use a wireless router to extend wireless access to wireless access points?
- Ruby - Insert Struct to MySql
- how to find my Symantec pcAnywhere serial number
- About direct X / Open GL issue
- How to determine eclipse version?
- What SAN cert Exchange 2010 for UM, OA?
- How do I populate a SQL Express table from Excel file?
- code for express check out with Paypal.
- Problem with Templated User Control
- ShellExecute SW_HIDE
programming4us programming4us