Modifying Your Chart’s Layout
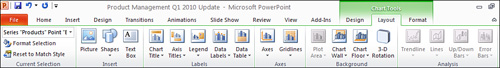
The Chart Tools—Layout tab, as shown in Figure 3, enables you to change your chart type, edit chart data, and apply chart layouts and styles.
Inserting Objects
To
dress up your charts even more, you can add additional objects such as
pictures, shapes, and text boxes. The Insert group on the Chart
Tools—Layout tab offers three buttons:
Pictures— Click the Picture button to open the Insert Picture dialog box where you can choose a picture on your computer or network.
Shapes— Click the Shapes button to display the Shapes gallery.
Text boxes— Click the Text Box button to draw a text box on your slide.
Modifying Chart Labels
In the Labels group on the Chart Tools—Layout tab, you can modify the following labels:
Chart Title— Display your chart title as a centered overlay, above the chart, or not at all.
Axis Titles—
Display the primary horizontal axis title below the axis or not at all.
Display the primary vertical axis title in one of three formats
(rotated, vertically, or horizontally) or not at all.
Legend— Display the legend at the right, top, left, or bottom; as an overlay at the right or left; or not at all.
Data Labels—
Display data labels in one of four ways in relation to the data point
(centered, inside the end, inside the base, or outside the end) or not
at all.
Data Table— Display a data table with or without a legend key or not at all.
|
It’s
sometimes hard to imagine how all these label options will actually
look on your chart, so you might need to experiment a bit to find the
format that works best.
|
Select the More link at the end of each menu to open
the Format Data Table dialog box where you can select from additional
options.
Modifying Chart Axes
To modify the horizontal or vertical axis, click the
Axes button on the Chart Tools—Layout tab and select one of the
following from the menu:
Primary Horizontal Axis— Display the axis from left to right with labels, from right to left with labels, without labels, or not at all.
Primary Vertical Axis—
Display the axis with the default order and labels, with numbers in the
thousands, with numbers in the millions, with numbers in the billions,
with a log scale, or not at all.
Modifying Chart Gridlines
To modify the horizontal or vertical axis, click the
Axes button on the Chart Tools—Layout tab, and select one of the
following from the menu:
Primary Horizontal Gridlines— Display horizontal gridlines for major units, minor units, major and minor units, or not at all.
Primary Vertical Gridlines— Display vertical gridlines for major units, minor units, major and minor units, or not at all.
Depth Gridlines— Display depth gridlines for major units, minor units, major and minor units, or not at all.
Modify Chart Backgrounds
If you don’t like the default background of your
chart, you can modify it or remove it altogether. Depending on the type
of chart on your slide, one or more of the following buttons might be
available in the Background group on the Chart Tools—Layout tab:
Plot Area— Display the chart plot area with the default fill color, or remove this fill.
Chart Wall— On 3-D charts, display the chart wall with the default color fill, or remove this fill.
Chart Floor— On 3-D charts, display the chart floor with the default color fill, or remove this fill.
3-D Rotation— Choose from numerous rotation options in the Format Chart Area dialog box.
Analyzing Chart Data
If you want to analyze the data on your chart, you
can add trendlines, other lines such as drop lines or high-low lines,
up/down bars, or error bars.
Depending on the type of chart on your slide, one or
more of the following buttons might be available in the Analysis group
on the Chart Tools—Layout tab:
Trendline—
Display a linear, exponential, linear forecast, or two-period moving
average trendline based on a specific series in your chart, or remove
all trendlines.
Lines— Display drop lines, high-low lines, or remove all lines on a line chart.
Up/Down Bar— Display up/down bars, or remove all bars on a line chart.
Error Bars— Display error bars using standard error, by percentage or with standard deviation, or remove all error bars.