3. Using Other Performance Monitoring Tools
Performance Monitor allows you to monitor various
different parameters of the Windows Server 2008 operating system and
associated services and applications. However, you can use three other
tools to monitor performance in Windows Server 2008. They are Network Monitor, Task Manager, and Event Viewer.
All three of these tools are useful for monitoring different areas of
overall system performance and for examining details related to
specific system events. In the following sections, we'll take a quick
look at these tools and how you can best use them.
3.1. The Network Monitor
Although Performance Monitor is a great tool for
viewing overall network performance statistics, it isn't equipped for
packet-level analysis and doesn't give you much insight into what types
of network traffic are traveling on the wire. That's where the Network
Monitor tool comes in. There are two main components to the Network
Monitor: the Network Monitor Agent and the Network Monitor tool itself.
The Network Monitor Agent is available with Windows
2000, XP, Server 2003, and Server 2008. The agent allows you to track
network packets. When you install the Network Monitor Agent, you will
also be able to access the Network Segment System Monitor counter.
On Windows Server 2008 computers, you'll see the
Network Monitor icon appear in the Administrative Tools program group.
You can use the Network Monitor tool to capture data as it travels on
your network.
NOTE
A limited version of Network Monitor is
available for free with Windows Server 2008. The full version of
Network Monitor is available at Microsoft's download server. For more
information, see www.microsoft.com/downloads/.
Once you have captured the data of interest, you can
save it to a capture file or further analyze it using the Network
Monitor. Experienced network and systems administrators can use this
information to determine how applications are communicating and the
types of data that are being passed via the network.
NOTE
For the exam, you don't need to understand the
detailed information that Network Monitor displays, but you should be
aware of the types of information that you can view and when you should
use Network Monitor.
3.2. The Task Manager
Performance Monitor is designed to allow you to keep
track of specific aspects of system performance over time. But what do
you do if you want to get a quick snapshot of what the local system is
doing? Creating a System Monitor chart, adding counters, and choosing a
view is overkill. Fortunately, the Windows Server 2008 Task Manager has
been designed to provide a quick overview of important system
performance statistics without requiring any configuration. Better yet,
it's always readily available.
You can easily access the Task Manager in several ways:
Right-click the Windows taskbar, and then click Task Manager.
Press Ctrl+Alt+Del, and then select Task Manager.
Press Ctrl+Shift+Esc.
Each of these methods allows you to quickly access a snapshot of the current system performance.
Once you access the Task Manager, you will see the following six tabs:
Applications tab
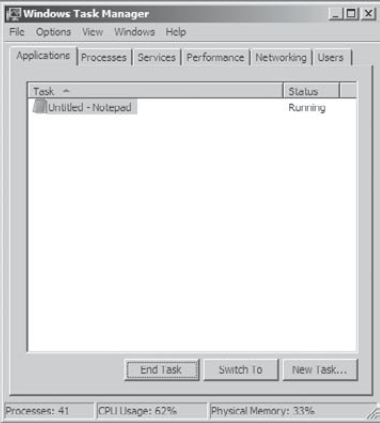
The Applications tab (see Figure 1)
shows you a list of the applications currently running on the local
computer. This is a good place to check to determine which programs are
running on the system. You can also use this tab to shut down any
applications whose status is listed as [Not Responding] (meaning either
that the application has crashed or that it is performing operations
and is not responding to Windows Server 2008).
Processes tab
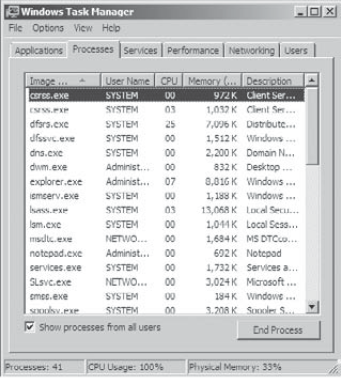
The Processes tab shows you all of the processes
that are currently running on the local computer. By default, you'll be
able to view how much CPU time and memory a particular process is
using. By clicking any of the columns, you can quickly sort by the data
values in that particular column. This is useful, for example, if you
want to find out which processes are using the most memory on your
server.
By accessing the performance objects in the View menu, you can add additional columns to the Processes tab. Figure 2 shows a list of the current processes running on a Windows Server 2008 computer.
Services tab
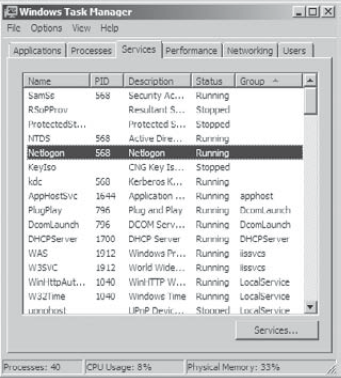
The Services tab (see Figure 3)
shows you what services are currently running on the system. From this
location, you can stop a service from running by right-clicking the
service and choosing Stop. The Services button launches the Services
MMC.
Performance tab
One of the problems with using Performance
Monitor to get a quick snapshot of system performance is that you have
to add counters to a chart. Most systems administrators are too busy to
take the time to do this when all they need is basic CPU and memory
information. That's where the Performance tab of the Task Manager comes
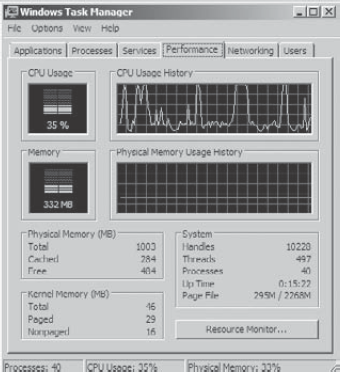
in. Using the Performance tab, you can view details about how memory is
allocated on the computer and how much of the CPU is utilized (see Figure 4).
Networking tab
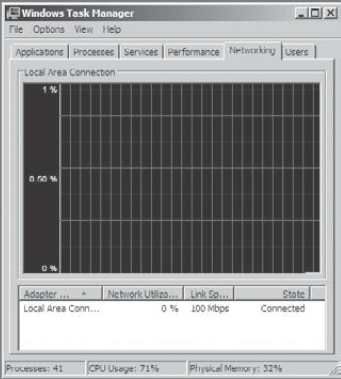
Like the Performance tab, the Networking tab (see Figure 5)
displays a graph of the current network utilization. The active
connections are displayed at the bottom of the tab along with their
connection speed, percentage of utilization, and status. The graph in
the top part of the tab displays the percentage of utilization in real
time.
Users tab
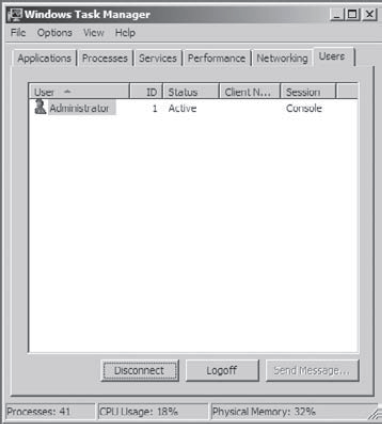
The Users tab (see Figure 6)
displays a list of the currently active user accounts. This is
particularly helpful if you want to see who is online and quickly log
off or disconnect users. You can also send a console message to any
remote user in the list by clicking the Send Message button. (The
button is grayed out in Figure 6 because you cannot send a message to yourself. If you select a different user, the button will be available.)
As you can see, the Task Manager is very useful for
quickly providing important information about the system. Once you get
used to using the Task Manager, you won't be able to get by without it!
NOTE
Make sure you use Task Manager often and
familiarize yourself with all that it can do; you can end processes
that have become intermittent, kill applications that may hang the
system, view NIC performance, and so on. In addition, you can access
this tool quickly to get an idea of what could be causing you problems.
All the performance monitoring tools (Task Manager, Event Viewer,
Network Monitor, and Performance Monitor) are great at getting granular
information on potential problems