IT tutorials
 
Technology
 

Active Directory 2008 Optimization and Reliability : Using Windows Server 2008 Performance Tools (part 2) - Viewing Performance Information

3/20/2014 1:44:37 AM
- Free product key for windows 10
- Free Product Key for Microsoft office 365
- Malwarebytes Premium 3.7.1 Serial Keys (LifeTime) 2019

2. Viewing Performance Information

The Windows Server 2008 Performance Monitor was designed to show information in a clear and easy-to-understand format. Performance objects, counters, and instances may be displayed in each of three views. This flexibility allows systems administrators to quickly and easily define the information they want to see once and then choose how it will be displayed based on specific needs. Most likely you will only use one view, but it's helpful to know what other views are available depending on what it is you are trying to assess.

You can use the following main views to review statistics and information on performance:
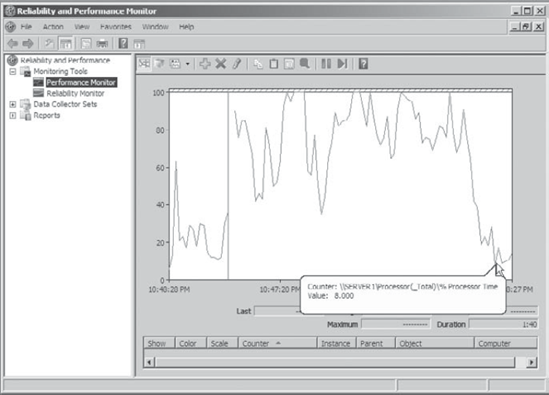

Graph view

The Graph view is the default display that is presented when you first access the Windows Server 2008 Performance Monitor. The chart displays values using the vertical axis and time using the horizontal axis. This view is useful if you want to display values over a period of time and or see the changes in these values over that time period. Each point that is plotted on the graph is based on an average value calculated during the sample interval for the measurement being made. For example, you may notice overall CPU utilization starting at a low value at the beginning of the chart and then becoming much higher during later measurements. This indicates that the server has become busier (specifically, with CPU-intensive processes). Figure 2 provides an example of the Graph view.

Figure 2. Viewing information in Performance Monitor Graph view

A quick way to get to the Performance Console and view Performance Monitor is to go to Start => Run and enter perfmon in the Open box. The Performance Console opens directly to Performance Monitor.
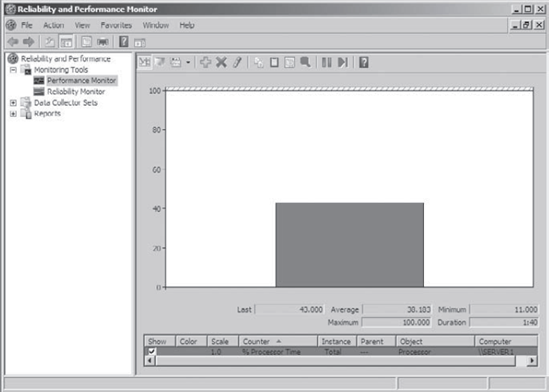


Histogram view

The Histogram view shows performance statistics and information using a set of relative bar charts. This view is useful if you want to see a snapshot of the latest value for a given counter. For example, if we were interested in viewing a snapshot of current system performance statistics during each refresh interval, the length of each of the bars in the display would give us a visual representation of each value. It would also allow us to visually compare measurements relative to each other. You can set the histogram to display an average measurement as well as minimum and maximum thresholds. Figure 3 shows a typical Histogram view.
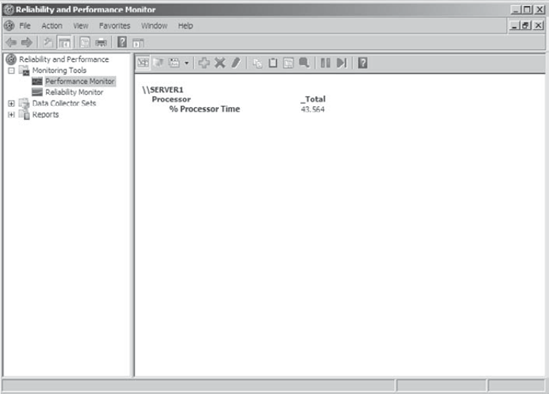
Figure 3. Viewing information in Performance Monitor Histogram view

Report view

Like the Histogram view, the Report view shows performance statistics based on the latest measurement. You can see an average measurement as well as minimum and maximum thresholds. This view is most useful for determining exact values because it provides information in numeric terms, whereas the Chart and Histogram views provide information graphically. Figure 4 provides an example of the type of information you'll see in the Report view.

Figure 4. Viewing information in Performance Monitor Report view
 
Others
 
- Active Directory 2008 Optimization and Reliability : Using Windows Server 2008 Performance Tools (part 1) - Deciding What to Monitor
- Active Directory 2008 Optimization and Reliability : Overview of Windows Server 2008 Performance Monitoring
- Deploying Exchange Server 2013 : Integrating Exchange server roles with Active Directory
- Deploying Exchange Server 2013 : Exchange Server messaging roles (part 4) - Deploying Transport services: The essentials
- Deploying Exchange Server 2013 : Exchange Server messaging roles (part 3) - Deploying Client Access servers: The essentials
- Deploying Exchange Server 2013 : Exchange Server messaging roles (part 2) - Deploying Mailbox servers: The essentials
- Deploying Exchange Server 2013 : Exchange Server messaging roles (part 1) - Understanding Exchange Server messaging roles
- Getting started with SharePoint 2013 sites : Saving a site as a template
- Getting started with SharePoint 2013 sites : Editing publishing site navigation
- Getting started with SharePoint 2013 sites : Editing the Top Link bar on a nonpublishing site
 
 
Top 10
 
- Microsoft Visio 2013 : Adding Structure to Your Diagrams - Finding containers and lists in Visio (part 2) - Wireframes,Legends
- Microsoft Visio 2013 : Adding Structure to Your Diagrams - Finding containers and lists in Visio (part 1) - Swimlanes
- Microsoft Visio 2013 : Adding Structure to Your Diagrams - Formatting and sizing lists
- Microsoft Visio 2013 : Adding Structure to Your Diagrams - Adding shapes to lists
- Microsoft Visio 2013 : Adding Structure to Your Diagrams - Sizing containers
- Microsoft Access 2010 : Control Properties and Why to Use Them (part 3) - The Other Properties of a Control
- Microsoft Access 2010 : Control Properties and Why to Use Them (part 2) - The Data Properties of a Control
- Microsoft Access 2010 : Control Properties and Why to Use Them (part 1) - The Format Properties of a Control
- Microsoft Access 2010 : Form Properties and Why Should You Use Them - Working with the Properties Window
- Microsoft Visio 2013 : Using the Organization Chart Wizard with new data
Technology FAQ
- Is possible to just to use a wireless router to extend wireless access to wireless access points?
- Ruby - Insert Struct to MySql
- how to find my Symantec pcAnywhere serial number
- About direct X / Open GL issue
- How to determine eclipse version?
- What SAN cert Exchange 2010 for UM, OA?
- How do I populate a SQL Express table from Excel file?
- code for express check out with Paypal.
- Problem with Templated User Control
- ShellExecute SW_HIDE
programming4us programming4us