Web analytics reports are an innate part of the
SharePoint 2010 installation. These reports are prebuilt. They use
collected data from the active SharePoint installation to present
information such as number of site collections, top destinations, top
pages, page views, and top referrers. Using this information, an
administrator can determine the flow of traffic. This is information
that will comprise part of the story for performance monitoring.
This recipe shows how to invoke the reports and how to view custom reports.
Getting ready
You must have farm-level administrative permissions to the Central Administration site.
How to do it...
Open up the SharePoint 2010 Central Administration website.
Under the Reporting section, click View Web Analytics reports.
Choose a web application by clicking on it.
The page that is presented contains a left-hand navigation, as shown here:

Click any of the above options and you will be
presented with the appropriate report. When the report is presented, it
is shown as a graph at the top and a grid at the bottom.&;&;
How it works...
The reporting data is collected by the usage data per
web application, per site collection, per site, and finally, per search
service application. The web analytics timer job runs as per its
schedule and updates the collected information. This recipe showed how
to access the reports through Central Administration. They can also be
accessed through the site collection and sites via the Site Actions drop-down list.
Web analytics is now part of the services infrastructure. It is called the Web Analytics Service Application. This must be provisioned and configured similar to setting up the other services, Service Applications.
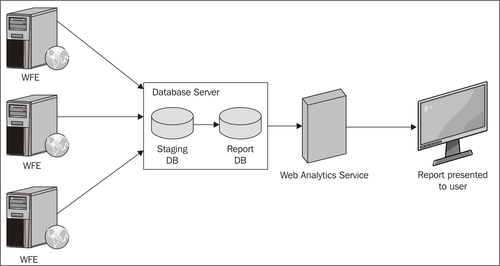
The following diagram shows the infrastructure components of the Web Analytics Service Application:

The information is collected on the web front-end
(WFE) servers into .usage files. Timer jobs kick off a process that
pulls the information into a staging database, where information is kept
for 24 hours. Information is then aggregated into the reporting
database, where it is retained for a period of 25 months by default.
There's more...
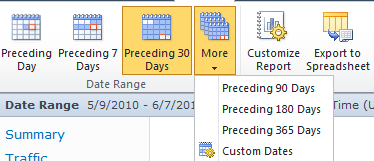
The data shown with date ranges can be modified. This can be achieved by clicking on the Change Settings link above the graph:

The following ribbon appears:

With a click of the appropriate date button, the data
will be filtered. Depending on the report, there may be filters other
than date.
Finally, the report can also be customized or
exported to Excel. This can be done with the help of the two buttons on
the right-most side of the preceding screenshot.
More info
Customized reports are also possible. There is an
Administrative Report Library in Central Administration. There are
folders in that library that contain reports written by someone in the
organization. These reports may be particular to an organization's needs
or audit concerns, among other things.
There is a Customized Reports
link on the left-hand navigation shown in a preceding screenshot;
currently, there is only Search Administration Reports in there.