Prior to SQL Server 2005 (and the
introduction of DMVs), SQL Server Profiler was one of the few tools
that could be used to gain visibility of SQL Server activity and was
therefore used for a broad range of performance and debugging purposes.
As you'll soon see, Profiler remains an extremely versatile tool;
however, it's often used for the wrong reasons, creating significant
performance problems as a result.
In this section, we'll focus
on using Profiler for alternate purposes, namely workload replay and
deadlocked/blocked process analysis. We'll also cover the important
difference between a Profiler trace and a server trace. Before we get
to that, let's begin with perhaps the most common use for Profiler:
workload analysis.
1. Workload analysis
A common task in a performance-tuning exercise is analyzing the cost
of the queries that make up an application's workload. For example, if
CPU is a significant system bottleneck, you need to establish which
queries consume the most CPU. Profiler enables such analysis through
its ability to capture, or trace, the execution of queries along with their associated cost metrics, that is, disk reads and writes, CPU usage, and duration.
As we've just explained, using Profiler as the only
performance-tuning tool ignores much more effective options; however,
for the purposes of introducing Profiler, let's proceed on that basis
with a simple example.
SQL Server Profiler
can be accessed through the Performance Tools folder of the SQL Server
program group. After opening Profiler and choosing File > New Trace,
you're prompted with the Connect to Server dialog box, which enables
you to select a SQL instance to trace. After connecting to an instance,
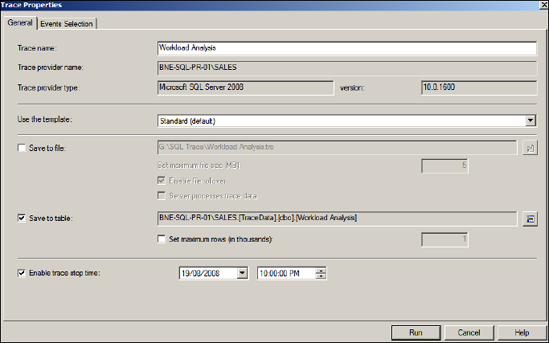
you're presented with the Trace Properties window, as shown in figure 1.

After
giving the trace a name, you can choose to base the trace on a
template, which is used to define the included columns and events on
the Events Selection tab, which we'll cover shortly. By default, the
output of the trace is displayed to screen only. For this example,
we'll choose to save the results to a table for reasons that will
become apparent shortly.
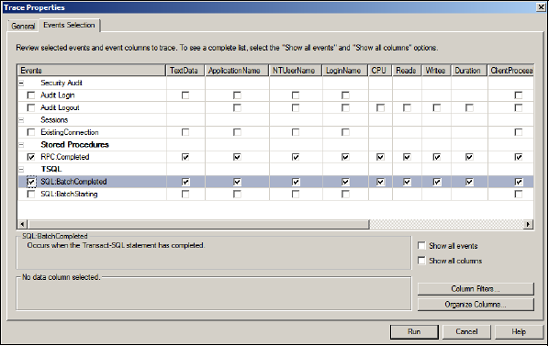
After entering an optional stop time (a trace can also be manually stopped), click the Events Selection tab, as shown in figure 2, to choose the included events and event columns.
For
the purposes of this example, we'll limit the included events to the
RPC:Completed and SQL:BatchCompleted events. These events represent the
completion of T-SQL batches and stored procedures and include the
associated cost metrics. The Column Filters button enables us to apply
filters, such as limiting the trace to include events for a particular
user or database, or queries exceeding a particular duration or cost.
As mentioned earlier, when we launch SQL Profiler via the Activity
Monitor's Processors pane, a filter is automatically applied for the
selected SPID.
Finally,
selecting the Show All Events and Show All Columns check boxes enables
the inclusion of additional events and columns from the full list,
rather than the limited set derived from the selected template on the
General tab.
Once you're ready, click Run,
and the trace begins and database activity matching the selected events
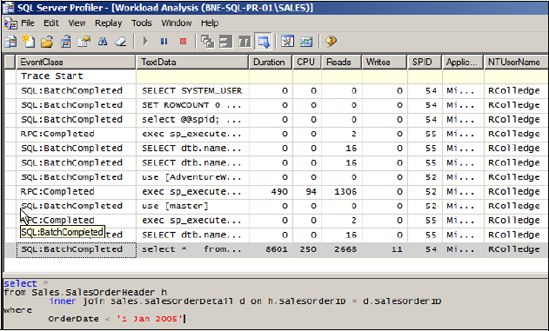
and filters is displayed on screen. For this example, a small number of
queries were executed in Management Studio after the trace was started,
the result of which is shown in figure 3.

A
quick inspection of the Profiler trace screen reveals that the values
of the Duration, CPU, and Reads columns for the last row are clearly
greater than the rest of the captured values. Clicking on this record
displays the query text in the lower section of the Profiler window.
For
a simple example such as this, you can visually browse the small number
of captured events. However, when a real trace is run and captured over
a period of time representing peak production activity, the number of
captured events typically runs into the thousands (or more). Not only
does this prevent a visual analysis of activity, but it can also cause
significant performance problems. In addressing this, you can use a server-side trace.
