2. SQL Server Agent
SQL
Server Agent is a component of SQL Server responsible for the scheduled
execution of tasks defined within jobs. Creating a maintenance plan
will automatically create SQL Server Agent jobs to execute the tasks
contained within the subplans. In our earlier example shown in figure 2, two SQL Server Agent jobs will be created to support the maintenance plan: AdventureWorks Maintenance Plan.Weekday and AdventureWorks Maintenance Plan.Weekend.
SQL
Server Agent jobs can be manually created in SQL Server Management
Studio by right-clicking Jobs under SQL Server Agent and choosing New
Job. The resultant window allows the specification of a job name and
schedule, along with a series of steps, each of which can be defined
with success and failure conditions to control the flow of job
execution. Each SQL Server Agent job step is created as a particular type; the available types include T-SQL, Operating System, and Integration Services Package.
A SQL Server Agent job with a PowerShell step to automate
the evaluation of a policy against a SQL Server 2005 instance. In terms
of more traditional database maintenance, common uses for SQL Server
Agent jobs include conditional index maintenance, as discussed earlier,
and running DBCC checks with options such as ALL_ERRORMSGS, an option
not available for selection when using the Check Database Integrity
Task in Maintenance Plan Tasks.
In
addition to its ability to automate jobs such as backups and index
maintenance, SQL Server Agent can be used to generate alerts, an
essential component of a successful monitoring regime.
3. Event alerts
Let's consider some of the undesirable things that may happen to a SQL Server instance at any point throughout the day:
A SQL Server Agent job fails.
A performance counter, for example, Batches/sec, approaches a critical level where performance is known to degrade.
A critical error is raised and written to the SQL Server error log.
Disk drives fill to capacity.
Critical error messages appear in the Windows event log.
As
you can imagine, the above list is only a very small selection of all
of the possible things that could go wrong, at any time of the day. The
problem is magnified when you consider each of these things could occur
on any number of the SQL Server instances being managed; consider a
site with hundreds of SQL Server instances, which is not uncommon. The
point to be made here is that in the absence of an alerting system that
automatically detects a variety of events and alerts the appropriate
people, the administration technique is either entirely reactive or
very inefficient (most likely both).
Fortunately,
there are a number of proven techniques for automated monitoring and
alerting for SQL Server. Without considering third-party products, the
frequently used ones are System Center Operations Manager and SQL
Server Agent.
Microsoft System Center Operations Manager
Previously
known (and commonly referred to) as Microsoft Operations Manager, or
MOM, this product is frequently deployed in organizations with large
amounts of server infrastructure under management. When deployed with
the optional SQL Server Management Pack, MOM enables the automation of
a number of proactive (and reactive) maintenance tasks, including the
following:
Regular connectivity checks to any number of SQL Server instances
Disk and database space monitoring
Monitoring and alerts for SQL Agent job failures (or those taking too long to complete)
Replication and database-mirroring health checks
Blocked process checks
SQL Service status checks
The
strength of the MOM product offering is the ability to use it not only
for SQL Server monitoring but for a wide variety of other
Microsoft-based infrastructure features such as Exchange, IIS, BizTalk,
and the Windows Server operating system. Thus, it's a widely used
option for large Microsoft-centric enterprise environments.
SQL Server Agent alerts
The starting point for enabling alerts in SQL Server Agent is through the creation of an operator.
Operators can be created in SQL Server Management Studio by
right-clicking Operators under SQL Server Agent and selecting New
Operator. Depending on the required notification method, each operator
can be created with a net send, email or pager address.
Email
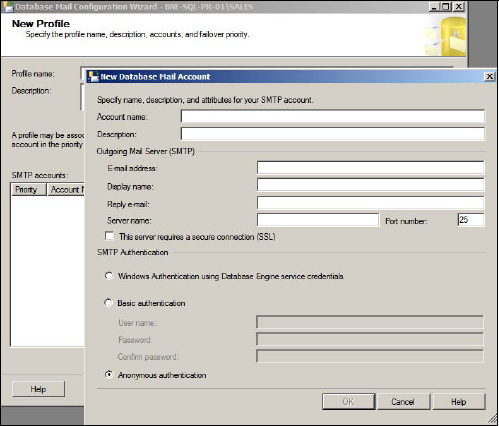
alerts are enabled in SQL Server through the use of Database Mail,
enabled in SQL Server Management Studio by right-clicking Database Mail
under Management and selecting Configure Database Mail. The Database
Mail Configuration Wizard then walks you through the required settings,
one screen of which is shown in figure 4.
Creating
operators with the appropriate notification method enables various
benefits such as the ability to produce notifications on job failures.
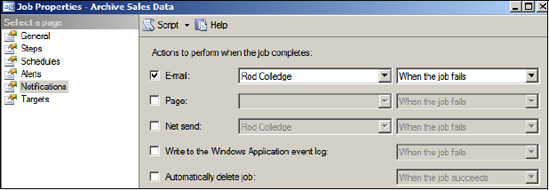
For example, as shown in figure 5,
the Notifications page of the Archive Sales Data SQL Server Agent job
is configured to notify Rod Colledge (via email) when the job fails.
In
addition to being notified of job failures, operators can be notified
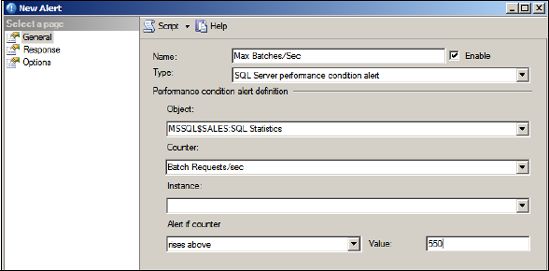
of alert conditions. An alert can be created in SQL Server Management
Studio by right-clicking Alerts under SQL Server Agent and selecting
New Alert. In the example shown in figure 6, we've created a SQL Server performance condition alert for when the Batch Requests/sec performance counter rises above 550.
In
addition to creating alerts for performance conditions, you can also
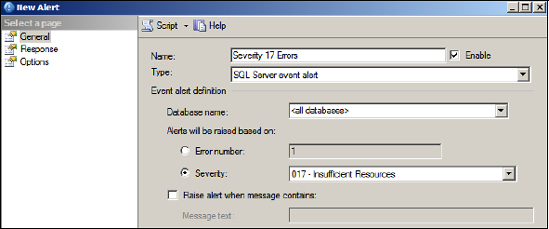
create alerts for SQL Server events. One of the recommended tasks for
each installed instance of SQL Server is to create alerts for severity
16 and above errors. You can achieve this using the SQL Server event
alert type, as shown in figure 7.
In
addition to severity-based errors, you can create alerts for specific
error events. For example, for a deadlock alert, you'd enter 1205 in
the Error Number box. Alternatively, you can use error numbers 34050
through 34053 for alerts on policy failures.
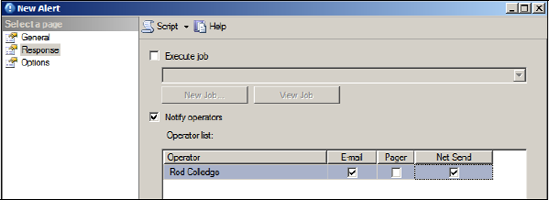
As shown in figure 7,
the Response page of the Alert properties enables the selection of an
operator for alert notification via the appropriate method in addition
to providing the option to execute a SQL Server Agent job in response
to the alert. In the above example, in addition to alerting an
operator, we may decide to execute a SQL Server Agent job that stops
nonessential services such as ad hoc reports.
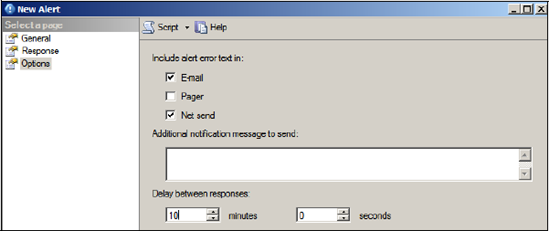
Finally, the Options page, shown in figure 9, enables additional options such as the delay between alerts and whether to include the error text in the alert condition.
Setting
up alerts is a basic yet crucial administration technique. Despite
this, it's often overlooked, as is the next task, monitoring error logs.
4. Error logs
Like
Windows, SQL Server maintains logs that you can browse for details on
both informational and error events. Accessed via Management Studio
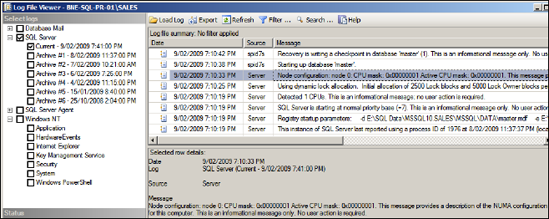
under the Management > SQL Server Logs path, the Log File Viewer can
be opened by double-clicking one of the listed logs.
SQL Server will start a new log each time the instance is started, and by default it will maintain six
archived logs before overwriting the oldest. Not only does the log file
viewer permit viewing of SQL Server information, it also allows the
Windows event logs to be viewed through the same interface.
In
addition to error events, the SQL Server logs contain valuable
diagnostic information, particularly around the startup time. For
example, in figure 10, you can see the NUMA node configuration is recorded to the log when the instance starts.
