Using Usage Views to Show Time-Phased Details
Microsoft Project has very powerful viewing and editing functions that are
enabled when you decide to use special display formats called Usage
views. You can access Usage views in many ways through the Ribbon, but
they are always under the View controls in the View groups on the Task,
Resource, and View tabs. There are three major view types that show
time-phased, sometimes also known as time-scaled, data details of
resource assignments. You should become thoroughly familiar with the
Usage views so that you can take advantage of several powerful features
to view and edit data.
The Task Usage view displays tasks with each
resource assigned within individual rows below the task. The Resource
Usage view simply inverts the data, showing resources with a list of
task assignments for each resource.
You can arrange the left half of a Usage view to
show numerous data columns based on the Table that you select, or you
can insert any combination of task and assignment columns you need. The
right half of the screen shows a detailed breakdown of the assignment
data, such as Work, Cost, Baseline Work, and so on. Figure 2
shows a typical layout of a Task Usage view with the Baseline Table
showing the columns on the left side and time-phased details on the
right.
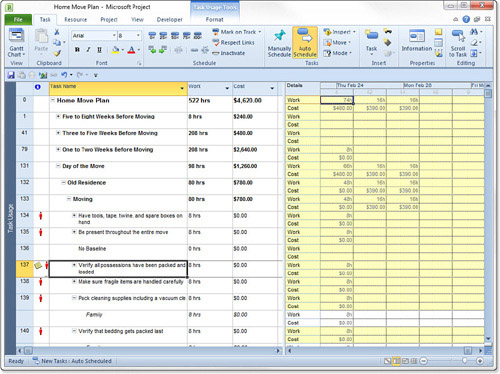
You can see tasks with assigned resources listed
below each task as you inspect the left side of the screen. Each task
and resource assignment row on the left side of the screen can have one
or more time-phased detailed row on the right side of the display. You
can right-click within the right-side data display to show more rows,
and also include other hidden rows if you select the Detail Styles menu
item.
Tip
You can right-click the
calendar header of a Usage view to adjust the display characteristics,
such as zoom factor and timescale column headers. |
The time-phased data rows on the right side of the
Usage view display show the internal details for each task and resource
assignment. You can zoom into a level of detail that shows date and
time information to 15-minute increments for each hour in each day. You
can also zoom out to show data in a year-by-year rollup.
You can directly edit many time-phased data fields
on the right side of the Usage view. Those fields are usually displayed
with a white background. The numbers you enter are internally
distributed between the task start and finish period for the selected
cell according to factors such as task and resource calendars.
Therefore, you need to be cautious when directly editing data in the
time-phased fields.
You should also be aware that most time-phased data
fields immediately roll up to the associated tasks or summary task
items and might also change the column data on the left side of the
Usage view. However, some time-phased fields do not immediately roll up
as you alter the time-phased data. Baseline data fields are an example of data that does not immediately roll up when you change the time-phased data.
Time-phased baseline data is copied from planning
data fields when you set the baseline using the Set Baseline control on
the Project tab. Taking a baseline essentially performs a general copy
and paste operation from planning data into the time-phased baseline
rows.
Some time-phased data field, such as Cost, might be
derived or calculated from other conditions such as individual resource
settings. You cannot directly edit the derived fields in the
time-phased fields, even though the data cells might have a white
background. Those data fields are calculated by factors such as
resource cost per hour, or cost per use settings.
You also need to be careful when editing Task Usage
time-phased data within the task rows, generally shown with a yellow
background. You can directly edit some of those time-phased data
fields, such as Work. Data you enter within a task row cell will be
distributed, also called rolled down, to the resources assignments for
that task. This type of edit can also transfer directly to the data
columns on the left side of the display.
You are encouraged to create some simple schedule
examples with resource assignments that you can use to experiment with
Task and Resource Usage views. Watch how edits made in the left side of
the display propagate to the right side time-phased data and vice
versa. Then watch what happens to time-phased data when you perform
functions such as setting a baseline. You will learn a lot about how
Project stores and manipulates internal data when you learn how to use
the Usage views.