The principal thing to remember when preparing to the base line your project is that neither the project nor the base line is crowned. As
much as you might like to think that your project is perfect,
conditions will change—usually things outside your control. It is
because of these changes that you need to baseline; using the baseline
helps you to track these changes. Although you should always make sure
to keep a copy of your original baseline, as you make changes to the
project, you can use one of the additional ten baselines to keep track
of the changes.
According to PMI’s PMBOK Guide,
a baseline is defined as “the original plan, plus or minus approved
changes.” Setting a baseline enables you to use variance and earned
value analysis to later understand how the work is performed and
whether the project is proceeding according to plan.
Viewing Baselines
Microsoft Project provides several methods to view baseline and tracking data.
Each task and resources assignment contains many types of information
such as task name, duration, work, cost, start and finish dates, and so
forth. When you select the Project tab, Schedule, Set Baseline, Project
copies key parts of the task and assignment data into special baseline
fields.
Project has several predefined combinations of view,
table, groups, and filter settings to let you review task and
assignment baseline data. You can also create and store your own
combinations of views and tables that show you information in a
familiar format. For instance, you can do the following:
Use the default views and tables to see baseline columns with additional columns you need.
Activate
filters and groups to show important baseline and tracking data based
on task completion status, assigned resources, and so forth.
Consider using the following helpful viewing combinations to review baseline and tracking information:
View the default Tracking Gantt with the
Baseline table to see baseline columns with Gantt bar overlay showing
plan vs. baseline duration.
View the Detailed Gantt with Delay table to see task slippage and free slack.
View the Multiple Baseline Gantt if you are comparing several baselines side-by-side.
View
the default Tracking Gantt with the Variance table to show differences
between the baseline and your current progress conditions.
View
the default Tracking Gantt with the Tracking table to see the data
field where you can enter progress information, such as: actual start,
%Complete, actual work, and so forth.
Select the View tab and then Group by Complete and Incomplete Tasks.
Tip
Remember that your current
view of your project’s schedule data can be modified in a variety of
ways, including the More Views selection underneath the Gantt Chart or
Task Usage controls or the Filter, Group By, and Tables controls on the
View tab. These tricks enable you to organize information and also see
settings or options that might be hidden. |
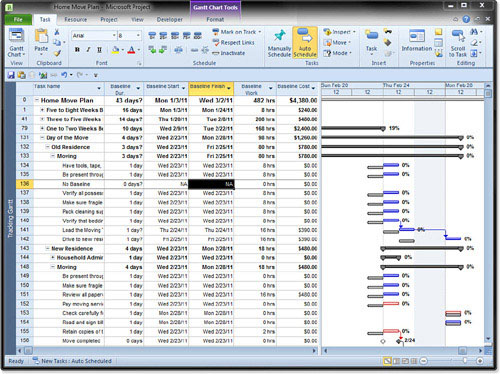
Figure 1
illustrates the combination of Tracking Gantt with the Baseline table.
You can add your own data columns, such as: work, % Complete, physical
% complete, and so forth to suit your needs. Notice how any task that
does not have baseline data will show “NA” in the data field and also
show missing bars within the Tracking Gantt view. Also notice how the
baseline Gantt bars might be shifted to the past or future, compared to
the current task start and finish dates.
