6. Traceview
Maybe the problem you’re trying to debug isn’t about
functionality. Maybe your application does exactly what it’s supposed to
do, but takes too long to do it. Wouldn’t it be nice to have a way of
seeing how the methods within your classes are interacting, and even to
keep track of the relative time spent executing in each method?
Traceview is a utility that allow you just that kind of visibility. It
consists of two parts, one that you enable before running your program
and one that you work with after the run in order to diagnose your
findings:
Runtime data collection
You can enable and disable logging for your application.
While enabled, routines are linked into your application that
create a binary trace file on the target. The trace file records
every method instantiation and the time spent in each
method.
Trace analysis
If you then copy the binary trace file from the target to
your host, you can run a trace analysis program that displays all
the information from the file in graphical form. You can easily
observe which methods are consuming most of the runtime, and drill
down into those methods to find out which methods they in turn
call and which of them consume the most time.
6.1. Trace data collection
The routines to perform trace data collection are provided in
the Android Software Development Kit. All you have to do is:
Import the Debug package
(android.os.Debug) into your application.
Call startMethodTracing
when you want to start collecting trace
information.
Call stopMethodTracing
when you’re done.
The tracing routines always write their trace information to a
file on the target’s SD card. If you’re running on a real device, you
need to plug in an SD card. If you’re debugging on the emulator, you
need to create a virtual SD card and tell the emulator to use
it:
Create a virtual SD card with mksdcard.
From the host command prompt, use the
mksdcard utility to create a file that the
emulator can use as a virtual SD card:
$ mksdcard -l ANDROID 1024M
									filename
You can create the file anywhere you like, but the root
directory for your project is a good place. The utility will
allocate a file as big as the size you’ve given in the
mksdcard command (1 GB in the example
shown).
Tell the emulator to use the virtual SD card.
In Eclipse, choose Window → Preferences → Android → Launch.
You’ll see a box there for emulator options. Add the following
option:
-sdcard filename
Use the complete path to the file, so the emulator can
always find it, no matter where it’s running from.
As an example of the code needed, let’s add tracing to MicroJobs
and collect some data. We add tracing to MicroJobs.java as follows:
...

import android.os.Debug;

...

    public void onCreate(Bundle savedInstanceState) {
        super.onCreate(savedInstanceState);

        // start trace
        Debug.startMethodTracing("x");

...

    // stop tracing when application ends
    @Override
    public void onDestroy() {
        super.onDestroy();
        Debug.stopMethodTracing();
    }
Running MJAndroid now creates a file named x.trace on the virtual SD card on the target. When tracing is
enabled, the Dalvik virtual machine is noticeably slower to start up
and slower to run, because it is mapping the virtual SD card into
memory, and collecting all the method call and timing data for you as
it runs. For this example we went through a few UI operations and then
closed the application.
To analyze x.trace, move it
back to the host:
$ adb pull sdcard/x.trace x.trace
and start the Traceview program:
$ traceview
							pathnamex.trace
For the moment at least, Traceview expects the full pathname of
the trace file.
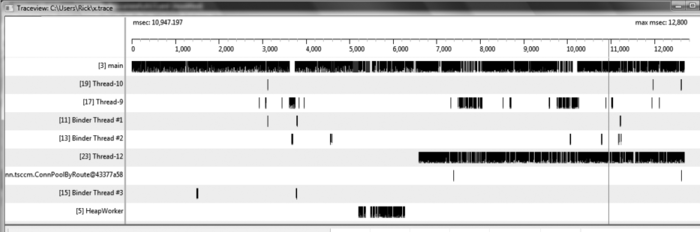
You are rewarded with a display of all the methods that were
called between the time you started and stopped the trace—not just the
methods in your application, but all the methods
that were called. The top part of the display is the Timeline Panel,
which looks something like Figure 5-12. The numbered line across the
top is a timeline (in milliseconds), with each application thread
listed as a separate row. Within each row, each method invocation is
shown as a little colored block (a little hard to see at the startup
resolution). The colors map to a list of methods shown in Figure 12.
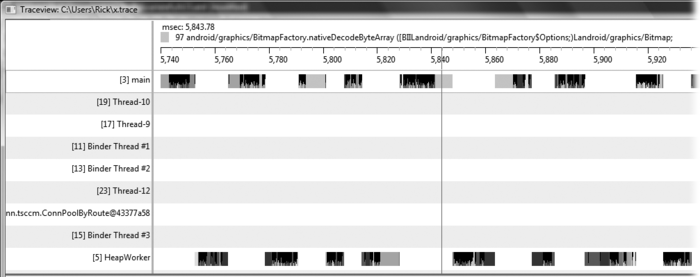
You can zoom in on a region of interest by moving the mouse into
the timeline area, clicking the left mouse button at the start time of
interest, dragging to the stop time, and releasing the button. The
timeline then zooms in, as shown in Figure 13. As you move the mouse
from left to right, the timeline cursor shows the sequence of method
calls, and the method names are called out in the upper right.
The bottom part of the Traceview display lists each method, in
declining order by the amount of time spent in it. The first part of
that list is shown in Figure 14.
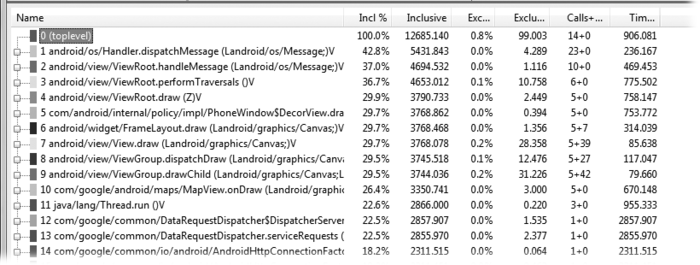
The columns in this display have the following meanings:
Name
You can’t see colors here, but on the screen, the color in
the color-coded box to the left of each name tracks to the
timeline shown in Figure 12. The 15 colors get
reused in order by inclusive time, as you go down the
list.
Incl% and Inclusive
The time (and percentage of total time) spent in this
method, including all the methods that it called. The times are
in milliseconds, but they should be interpreted with care.
Because tracing slows down execution considerably, these times
do not represent the true runtimes under normal execution. They
do provide accurate relative timing information when comparing
the runtimes of two methods.
Excl% and Exclusive
The time (and percentage of total time) spent actually
executing in this method. In other words, any time spent in
nested functions is removed from these two fields. The same
timing caveats apply to Exclusive times as to Inclusive.
Calls+Recursive calls
Two values: the number of times this method was called
externally and the number of times it called itself.
Time/Call
Simply the quotient of the second column divided by the
sum of the numbers in the sixth column.
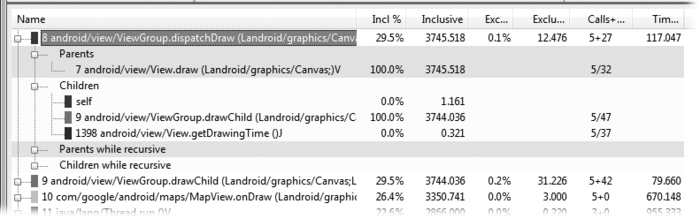
When you select a method by clicking on its name in the Profile
Panel, Traceview adjusts the pane to bring that method to the top of
the view, and opens a list of Parent and Child methods, as shown in
Figure 15. “Parents” are methods
that call this method. “Children” are methods called by this
method.
Clearly, there is a lot of information available in the
Traceview records. We’ll leave other features of Traceview for you to explore, such
as the use of Native Tracing to trace the QEMU emulator itself, the
use of the other Debug methods to get timing information, and the use
of the dmtracedump utility to generate call
graphs.