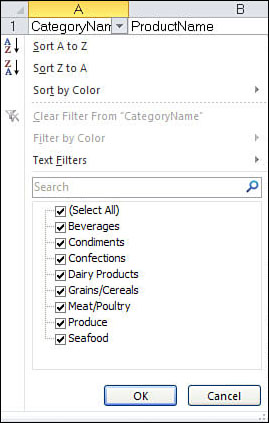
You can use several methods for filtering from the filter drop-down after the filter is turned on, as shown in Figure 1. The next several sections review these methods.
Filter Listing for Listed Items
The filter listing is probably the most obvious
filter tool when you open the drop-down. For text, numbers, and
ungrouped dates, a listing of all unique items in the column appears . All items will be
checked, because they are all visible the first time you open the
drop-down, but you can select just the items that should appear in the
data. Any item that no longer bears a check mark will be hidden.
Filtering a Column for Specific Items
To filter a column for specific items, follow these steps:
|
If filtering an existing table, skip to step 3.
|
1. | Select a single cell in the dataset to apply filtering to.
|
2. | In
Excel or Excel Starter, go to Home, Sort & Filter, Filter. In the
Web App, go to Home, Sort & Filter as Table. The Web App will
verify the range to be converted to a table. Click OK to continue.
|
3. | Open the drop-down of the column to filter.
|
4. | If
in Excel or Excel Starter, skip to step 5. Otherwise, in the Excel Web
App, click Filter in the drop-down to open the filter listing dialog.
|
5. | Unselect the Select All item to clear all the check marks in the list.
|
6. | Select the item(s) to be viewed in the dataset.
|
7. | Click OK. The sheet will update, showing only the item(s) selected.
|
Grouped Dates Filter Listing
|
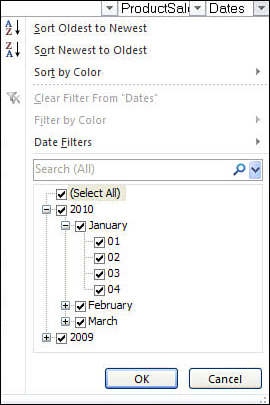
This section applies to dates that are grouped, as shown in Figure 2.
In Excel and Excel Starter, the grouping is controlled by a setting
found under File, Options, Advanced, Display Options for This Workbook,
Group Dates in the AutoFilter Menu. By default, this option is
selected. If unselected, the dates will appear in a list like the
filter for number and text items.
|
Dates in the filter listing are grouped by year,
month, and day. All items will be checked, because they are all visible
the first time you open the drop-down, but you can select just the
items that should appear in the data. Any item that no longer bears a
check mark will be hidden.
If you click the + icon by a year, it opens up,
showing the months. Click the + icon by a month and it opens up to show
the days of the month. An entire year or month can be selected or
unselected by clicking the desired year or month. For example, to
deselect 2009 and January 2010 in Figure 2, deselect the 2009 group, then deselect the January group under 2010. The data will filter to show only February and March 2010.
Filtering a Column for Specific Dates
To filter a column for specific dates, follow these steps:
|
If filtering an existing table, skip to step 3.
|
1. | Select a single cell in the dataset to apply filtering to.
|
2. | In
Excel or Excel Starter, go to Home, Sort & Filter, Filter. In the
Web App, go to Home, Sort & Filter as Table. The Web App will
verify the range to be converted to a table. Click OK to continue.
|
3. | Open the drop-down of the column to filter.
|
4. | If
in Excel or Excel Starter, skip to step 5. Otherwise, in the Excel Web
App, click Filter in the drop-down to open the filter listing dialog.
|
5. | Deselect the Select All item to clear all the check marks in the list.
|
6. | Click the + icon to the left of the desired year.
|
7. | Click the + icon to the left of the desired month. |
8. | Select the desired days.
|
9. | Repeat steps 6 to 8 as needed.
|
10. | Click OK. The sheet updates, showing only the dates selected. |