When you create or select a shape, the contextual Drawing Tools—Format tab appears, shown in Figure 1.
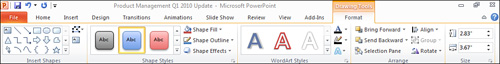
The Insert Shapes and Shape
Styles groups on the Drawing Tools—Format tab are the centerpieces of
PowerPoint’s suite of shape creation and formatting tools. They offer a
multitude of options for modifying and enhancing presentation shapes,
such as specifying a shape’s fill, outline, and effects.
The Home tab also offers most, but not all, of the shape formatting features available on the Drawing Tools—Format tab.
Working with Shape Quick Styles
One way to format a shape
quickly is to apply a quick style. Quick Styles offer numerous fill,
shading, and border options in colors that coordinate with your chosen
theme.
Applying a Shape Quick Style
To apply a Quick Style to a shape, follow these steps:
1. | Select the shape to which you want to apply the style.
|
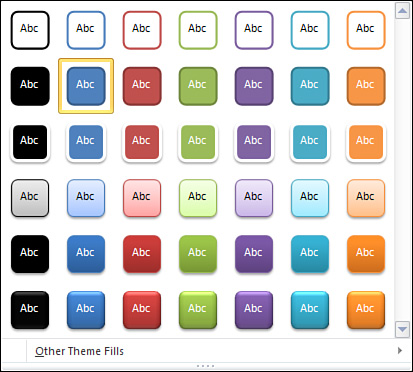
2. | On
the Drawing Tools—Format tab, click the down arrow to the right of the
Shape Styles box to open the Shape Styles gallery, as shown in Figure 2.
|
You can also open the Shape Styles gallery by clicking the Quick Styles button on the Home tab.
|
|
3. | Pause your mouse over an available style to preview the style’s effect on your shape.
|
4. | Optionally,
click Other Theme Fills at the bottom of the gallery to open a palette
of additional options, including several grayscale options.
|
As a shortcut, you can click
one of the styles that display in the Shape Styles box on the tab itself
without opening the gallery. The default view shows three possible
styles.
|
|
5. | Click a style to apply it to the selected shape.
|
Specifying Shape Fill Color
To set a shape’s fill
color, select it, and on the Drawing Tools—Format tab, click the down
arrow to the right of the Shape Fill button. A palette displays, as
shown in Figure 3.
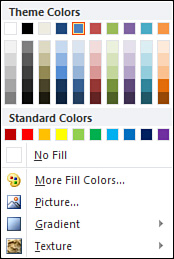
You can do any of the following in this palette:
- Apply one of the theme, standard, or recent colors. The theme colors are compatible with your slide’s color scheme.
- Click No Fill to make the object transparent. You see the slide background through the object.
- Click More Fill Colors to open the Colors dialog box, from which you can choose from many other colors or create a custom color.
- Click Picture to fill your shape with a picture you select.
- Click Gradient to apply a light or dark gradient pattern.
- Click Texture to fill the shape with one of the available texture patterns in the gallery that appears.
Using the Colors Dialog Box
Click More Fill Colors in the palette to open the Colors dialog box, as illustrated in Figure 4.
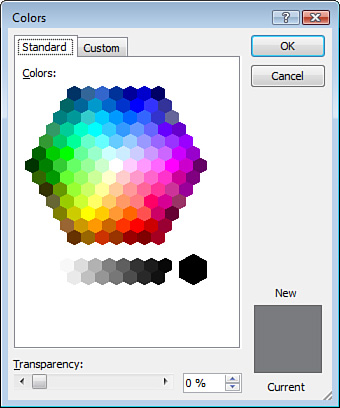
To choose a new color, select
it in the palette on the Standard tab. The color appears in the New
section of the preview box to contrast with the Current color.
|
You can set transparency
(making the color appear transparent) by dragging the Transparency
scrollbar or by entering a specific transparency percentage. The higher
the percentage, the more transparent the color, which enables things
behind the object to show through.
|
Click OK to keep the color or Cancel to return to the original color.
Using a Custom Color
To add a custom color, click the Custom tab on the Colors dialog box, as shown in Figure 5.
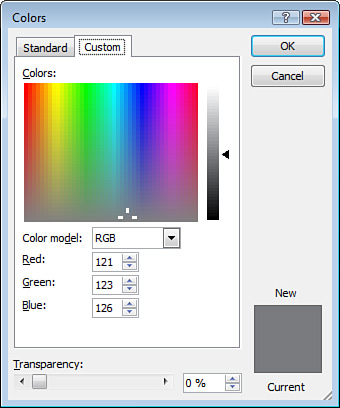
You can create a custom color
in two ways. One way is to click and drag the crosshair in the Colors
area until you find the color you want. The other way is to choose
either RGB or HSL in the Color Model field and then adjust the color’s
level of red, green, and blue (for RGB) or hue, saturation, and
luminance (for HSL). Click OK to keep the color, or click Cancel to
discard it.
|
Red, green, and blue
represent the amount of each of these primary colors in the color you
create. The RGB color wheel used in PowerPoint is based on projected
light—the kind you see with computer screen projection.
Hue represents the actual color, saturation represents the color’s intensity, and luminance represents the color’s brightness. In general, the lower the number, the lighter or less intense the color is.
|
Applying a Picture Fill
You can even fill an object
with a picture. For example, you could create a shape such as a circle
and fill with a logo, product image, or photo. On the Drawing Tools—Format tab, click the down arrow to the right of the Shape Fill button, and choose Picture from the menu.
The Insert Picture dialog
box opens. Find and select your picture, and click the Insert button to
fill the shape with the selected picture.
|
Some pictures just don’t look
good as fills. Look at yours carefully. If it doesn’t look good, press
Ctrl+Z to undo it, and then apply some other fill.
|
Applying a Gradient Fill
A gradient creates a smooth
transition from one color to another, using gentle blending. To apply a
gradient to a selected shape, on the Drawing Tools—Format tab, click the
down arrow to the right of the Shape Fill button, and select Gradient
from the menu. From the gallery that appears, you can apply a light or
dark gradient. Pause your mouse over each available gradient to preview
its effect on your presentation. Click the gradient to apply to your
presentation. To remove a gradient, select No Gradient in the gallery.
|
For more gradient options, click More Gradients in the gallery to open the Format Shape dialog box.
|
Applying a Textured Fill
To apply a texture to a
selected shape, on the Drawing Tools—Format tab, click the down arrow to
the right of the Shape Fill button, and choose Texture from the menu.
Select your preferred texture from the gallery (see Figure 6), pausing your mouse over each option to preview it on your presentation.
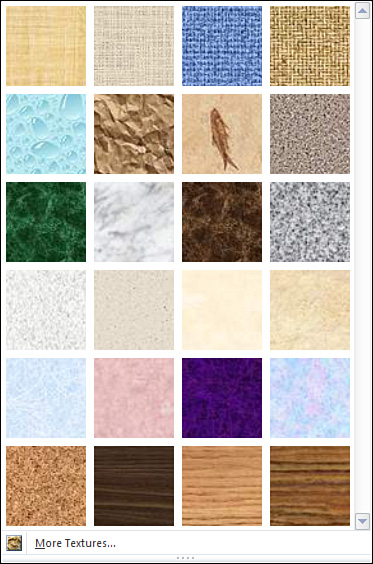
For more options, click More Textures in the gallery to open the Format Shape dialog box.