3. The Event Viewer
The Event Viewer is also useful for monitoring
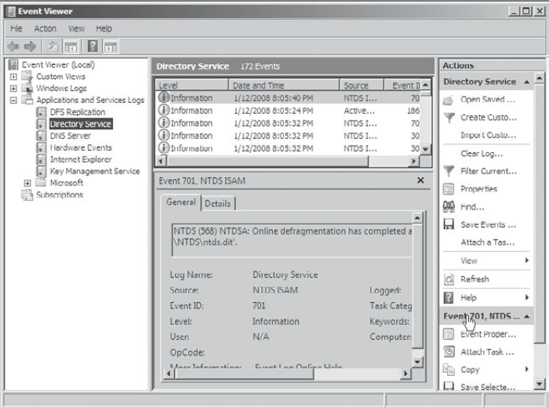
Active Directory information. Specifically, you can use the Directory
Service log to view any information, warnings, or alerts related to the
proper functioning of the directory services. You can access the Event
Viewer by selecting Start => Programs => Administrative Tools =>
Event Viewer. Clicking any of the items in the left pane displays the
various events that have been logged for each item. The contents of
Directory Service log are shown in Figure 7.

Each event is preceded by a blue "i" icon. That icon
designates that these events are informational and do not indicate
problems with the Directory Service. Rather, they record benign events
such as Active Directory startup or a domain controller finding a
Global Catalog server.
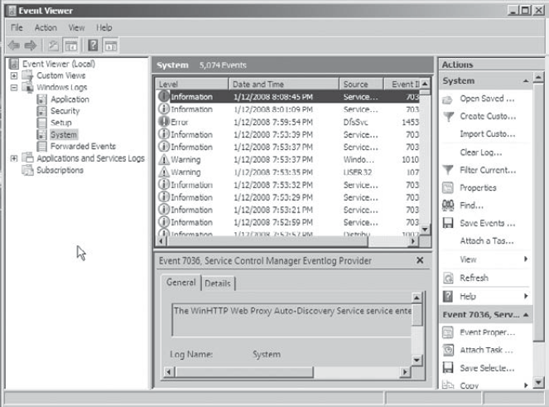
Problematic or potentially problematic events are
indicated by a yellow Warning icon or a red Error icon, both of which
are shown in Figure 8.
Warnings usually indicate a problem that wouldn't prevent a service
from running but might cause undesired effects with the service in
question. For example, we were configuring a site with some fictional
domain controllers and IP addresses. Our local domain controller's IP
address wasn't associated with any of the sites, and the Event Viewer
generated a Warning. In this case, the local domain controller could
still function as a domain controller, but the site configuration could
produce undesirable results.

Error events almost always indicate a failed
service, application, or function. For instance, if the dynamic
registration of a DNS client fails, the Event Viewer generates an
Error. As you can see, errors are more severe than warnings, because in
this case, the DNS client cannot participate in DNS at all.
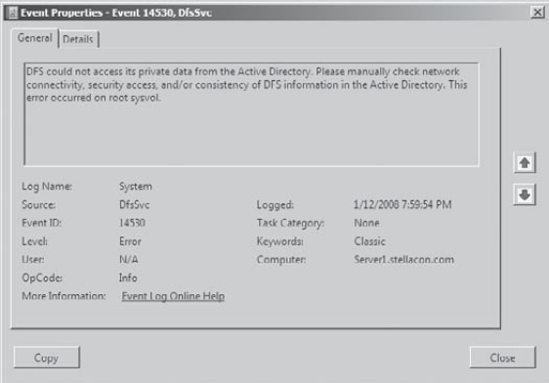
Double-clicking any event opens the event's Properties dialog box, as shown in Figure 9. The Event Properties dialog box displays a detailed description of the event.

The Event Viewer can display thousands of different
events, so it would be impossible to list them all here. Just be aware
that information events are always benign, warnings indicate
noncritical problems, and errors indicate show-stopping events.
4. Troubleshooting Active Directory Performance Monitoring
Monitoring performance is not always an easy
process. As mentioned earlier, the act of performance monitoring can
use up system resources. One of the problems that may then occur is
that Performance Monitor cannot obtain performance statistics and
information quickly enough. If this occurs, you'll receive an error
message. In this case, the suggestion is to increase the sample
interval. This will reduce the number of statistics Performance Monitor
has to record and display, and it may prevent the loss of performance
information.
Sometimes, when you're viewing performance
information in the Chart or Histogram view, the data is either too
small (the bar or line is too close to the baseline) or too large (the
bar or line is above the maximum value). In either case, you'll want to
adjust the scale for the counter so that you can accurately see
information in the display. For example, if the scale for the number of
logons is 1 when it displays values from 0 to 100 and you frequently
have more than 100 users per server, you might want to change the scale
to a value less than 1. If you choose 1/10, you will be able to
accurately see up to 1000 user logons in the Chart and Histogram views.
You can adjust the scale by right-clicking Performance Monitor display,
selecting Properties, and then accessing the Data tab.