IT tutorials
 
Technology
 

Active Directory 2008 Optimization and Reliability : Using Windows Server 2008 Performance Tools (part 3) - Managing Performance Monitor Properties

3/20/2014 1:46:23 AM
- Free product key for windows 10
- Free Product Key for Microsoft office 365
- Malwarebytes Premium 3.7.1 Serial Keys (LifeTime) 2019

3. Managing Performance Monitor Properties

You can specify additional settings for viewing performance information within the properties of Performance Monitor. You can access these options by clicking the Properties button in the taskbar or by right-clicking Performance Monitor display and selecting Properties. You can change these additional settings using the following tabs:


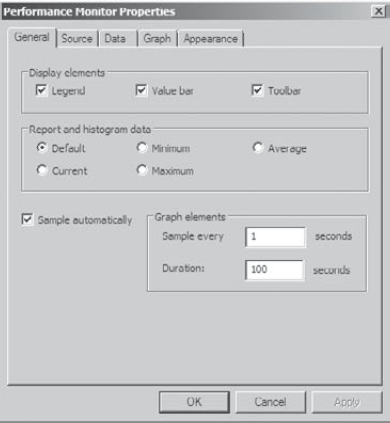
General tab

On the General tab (shown in Figure 5), you can specify several options that relate to Performance Monitor view.

  • You can enable or disable legends (which display information about the various counters), the value bar, and the toolbar.

  • For the Report and Histogram views, you can choose which type of information is displayed. The options are Default, Current, Minimum, Maximum, and Average. What you see with each of these options depends on the type of data being collected. These options are not available for the Graph view, because the Graph view displays an average value over a period of time (the sample interval).

  • You can also choose the graph elements. By default, the display will be set to update every second. If you want to update less often, you should increase the number of seconds between updates.

Figure 5. General tab of Performance Monitor Properties dialog box

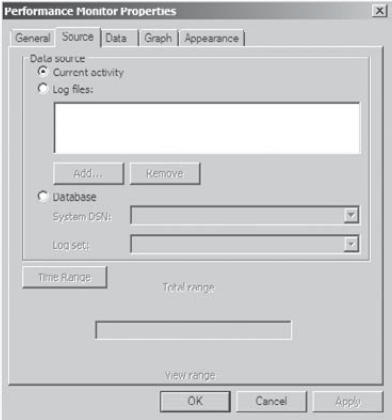
Source tab

On the Source tab (shown in Figure 6), you can specify the source for the performance information you would like to view. Options include current activity (the default setting) or data from a log file. If you choose to analyze information from a log file, you can also specify the time range for which you want to view statistics. We'll cover these selections in the next section.

Figure 6. Source tab of Performance Monitor Properties dialog box

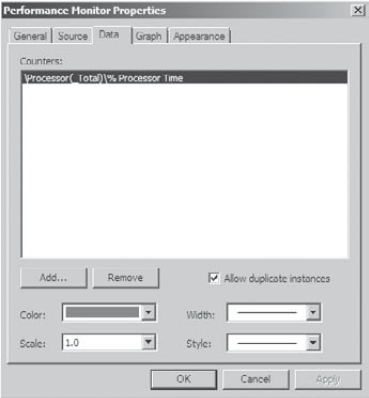
Data tab

The Data tab (shown in Figure 7) displays a list of the counters that have been added to Performance Monitor display. These counters apply to the Chart, Histogram, and Report views. Using this interface, you can also add or remove any of the counters and change properties, such as the width, style, and color of the line, and the scale used for display.

Figure 7. The Data tab of Performance Monitor Properties dialog box

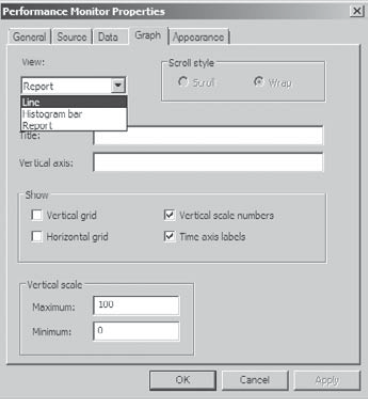
Graph tab

On the Graph tab (shown in Figure 8), you can specify certain options that will allow you to customize the display of Performance Monitor views. First you can specify what type of view you want to see (Line, Histogram Bar, or Report). Then you can add a title for the graph, specify a label for the vertical axis, choose to display grids, and specify the vertical scale range.

Figure 8. The Graph tab of Performance Monitor Properties dialog box

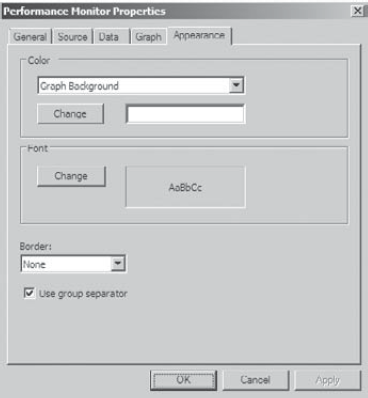
Appearance tab

Using the Appearance tab (see Figure 9), you can specify the colors for the areas of the display, such as the background and foreground. You can also specify the fonts that are used to display counter values in Performance Monitor views. You can change settings to find a suitable balance between readability and the amount of information shown on one screen. Finally, you can set up the properties for a border.

Figure 9. The Appearance tab of Performance Monitor Properties dialog box

Now that you have an idea of the types of information Performance Monitor tracks and how this data is displayed, take a look at another feature that you will use to save and analyze performance data.

 
Others
 
- Active Directory 2008 Optimization and Reliability : Using Windows Server 2008 Performance Tools (part 2) - Viewing Performance Information
- Active Directory 2008 Optimization and Reliability : Using Windows Server 2008 Performance Tools (part 1) - Deciding What to Monitor
- Active Directory 2008 Optimization and Reliability : Overview of Windows Server 2008 Performance Monitoring
- Deploying Exchange Server 2013 : Integrating Exchange server roles with Active Directory
- Deploying Exchange Server 2013 : Exchange Server messaging roles (part 4) - Deploying Transport services: The essentials
- Deploying Exchange Server 2013 : Exchange Server messaging roles (part 3) - Deploying Client Access servers: The essentials
- Deploying Exchange Server 2013 : Exchange Server messaging roles (part 2) - Deploying Mailbox servers: The essentials
- Deploying Exchange Server 2013 : Exchange Server messaging roles (part 1) - Understanding Exchange Server messaging roles
- Getting started with SharePoint 2013 sites : Saving a site as a template
- Getting started with SharePoint 2013 sites : Editing publishing site navigation
 
 
Top 10
 
- Microsoft Visio 2013 : Adding Structure to Your Diagrams - Finding containers and lists in Visio (part 2) - Wireframes,Legends
- Microsoft Visio 2013 : Adding Structure to Your Diagrams - Finding containers and lists in Visio (part 1) - Swimlanes
- Microsoft Visio 2013 : Adding Structure to Your Diagrams - Formatting and sizing lists
- Microsoft Visio 2013 : Adding Structure to Your Diagrams - Adding shapes to lists
- Microsoft Visio 2013 : Adding Structure to Your Diagrams - Sizing containers
- Microsoft Access 2010 : Control Properties and Why to Use Them (part 3) - The Other Properties of a Control
- Microsoft Access 2010 : Control Properties and Why to Use Them (part 2) - The Data Properties of a Control
- Microsoft Access 2010 : Control Properties and Why to Use Them (part 1) - The Format Properties of a Control
- Microsoft Access 2010 : Form Properties and Why Should You Use Them - Working with the Properties Window
- Microsoft Visio 2013 : Using the Organization Chart Wizard with new data
Technology FAQ
- Is possible to just to use a wireless router to extend wireless access to wireless access points?
- Ruby - Insert Struct to MySql
- how to find my Symantec pcAnywhere serial number
- About direct X / Open GL issue
- How to determine eclipse version?
- What SAN cert Exchange 2010 for UM, OA?
- How do I populate a SQL Express table from Excel file?
- code for express check out with Paypal.
- Problem with Templated User Control
- ShellExecute SW_HIDE
programming4us programming4us