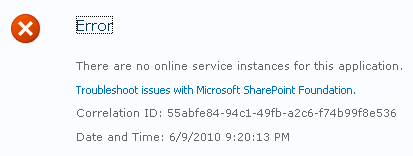
An undesirable thing for users of SharePoint is
getting an indefinite message that has a big red "X" and the word
"Error" in bold adjacent to it. The user has done something but the page
does not tell what the error is and how to fix this error. It only
points them to the site administrator, that is, you.
SharePoint 2010 has addressed this issue by creating a
mechanism to track communications between the web front-ends and the
user's requests. This is in the form of a GUID called the correlation ID.
Now when a user gets his/her error page, he/she can contact the
administrator and provide the correlation ID. The administrator can then
track the cause of this error using the correlation ID as a reference
in the ULS logs.
This recipe shows the steps to perform after the
correlation ID is provided to the administrator. To induce the error
with a correlation ID, we will stop the web analytics service.
Getting ready
You must have farm-level administrative permissions to the Central Administration site.
This recipe uses PowerShell. You must be a member of the SharePoint_Shell_Access database role on the configuration database. You also must be a member of the WSS_ADMIN_WPG local group&;.
How to do it...
In Central Administration, navigate to System Settings. Under Servers, click Manage services on server.
Click Stop associated with Web Analytics Web Service.
Click Monitoring on the left-hand side navigation.
Under Reporting, click View Web Analytics reports. The following error should be shown:

On the publishing farm server, select Start | All Programs | Microsoft SharePoint 2010 Products | SharePoint 2010 Management Shell.
In the PowerShell command prompt, type in the following command, replacing the correlation ID with the one from your screen.
Get-SPLogEvent | ?{$_.Correlation -eq "xxxxxxxx-xxxx-xxxx-xxxx-xxxxxxxxxxxx"}
It should produce a message from the log file that reads:
There are no
instances of the Web Analytics Service Application started on any server
in this farm. Ensure that at least one instance is started on an
application server in the farm using the Services on Server page in
Central Administration.
How it works...
The PowerShell command, Get-SPLogEvent, does the job of retrieving all events in the log files. The | character sends the output of Get-SPLogEvent to the next command. The ? is the "where" command. The curly braces is the "where" condition. The $_ notation&; is used to represent the object being sent across the pipeline. Finally, the -eq option represents the "equal to" condition.
As a whole, this statement does a search job in the
log files for a particular correlation ID, and produces the information
associated with the request.
A request is traced through its lifetime. The
correlation ID collects information across multiple servers maintaining
the integrity of the request. Different
sites can consume information from an application server that resides in
a different farm but is shared. Without the correlation ID, it would be
very difficult and cumbersome to trace an error.
When an error occurs, the correlation ID will have
the same reference across all of the servers. This applies to WFE,
application, web services, and any other components that are consumed.
There's more...
There are two other methods for looking up a correlation ID other than PowerShell. They are:
Using Excel (or notepad): Log on to the Web
Front End server that generated the error and navigate to the location
of the ULS logs. Open the log file in Excel and utilize the find and
innate filtering capabilities of Excel to find the correlation ID.
Utilizing the logging database: You can execute the Accessing the SharePoint 2010 logging database recipe and then look for the correlation ID.
More info
On Microsoft's site, there is a free ULS viewer that
can be utilized. This is not supported by Microsoft. It allows users to
open a ULS log file and display its contents in a readable manner. It
contains filtering, sorting, and many other functions that make the data
readable.