IT tutorials
 
Technology
 

Sharepoint 2013 : Creating List Views - Specify Totals for a View

1/14/2014 1:00:16 AM
- Free product key for windows 10
- Free Product Key for Microsoft office 365
- Malwarebytes Premium 3.7.1 Serial Keys (LifeTime) 2019

Scenario/Problem: You want to include a mathematical calculation on a column in a view. For example, you want the view to show an average of the numbers in a certain column or the total of another. For example, you have a number column called Number of Leave Days that is used to track how many leave days have been requested by a contact, and you want to create a view that displays the average leave requested by everyone in the list.


Solution: A total is a mathematical calculation that you can add to a view. The result of the calculation shows up at the top of the view, just under the header for the column being calculated. If you want to see some calculations of the values in a column, you can specify this under the Totals section of the view creation page.

Different column types can have different kinds of calculations. For example, a date column can show the count of unique date values in that column, and then average of the date values, and then the largest date or smallest one. A text column can show only the count of unique values because doing mathematical calculations on pieces of text is not possible. A number column can have more functions, such as sum (the sum of all the values in that column), standard deviation, and variance.

For example, if you have a number column called Number of Leave Days that is used to track how many leave days have been requested by a contact, you can create a view that displays the average leave requested by everyone in the list. The average shows up at the top of the view, just under the header for the column (see Figure 1).

Image

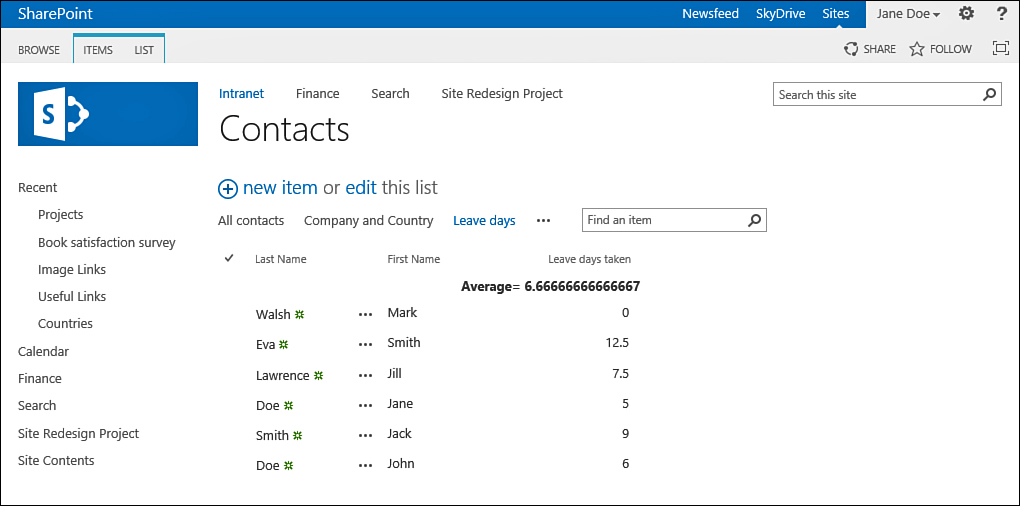
FIGURE 1 A view showing the average of a column.

To specify a total for one or more columns, scroll down to the Totals section in the view creation page and expand it by using the plus sign next to the section title. You then see a list of all the columns selected under the Columns section (see Figure 2). For each one, you can open the drop-down menu and choose the calculation that will be done for it.

Image

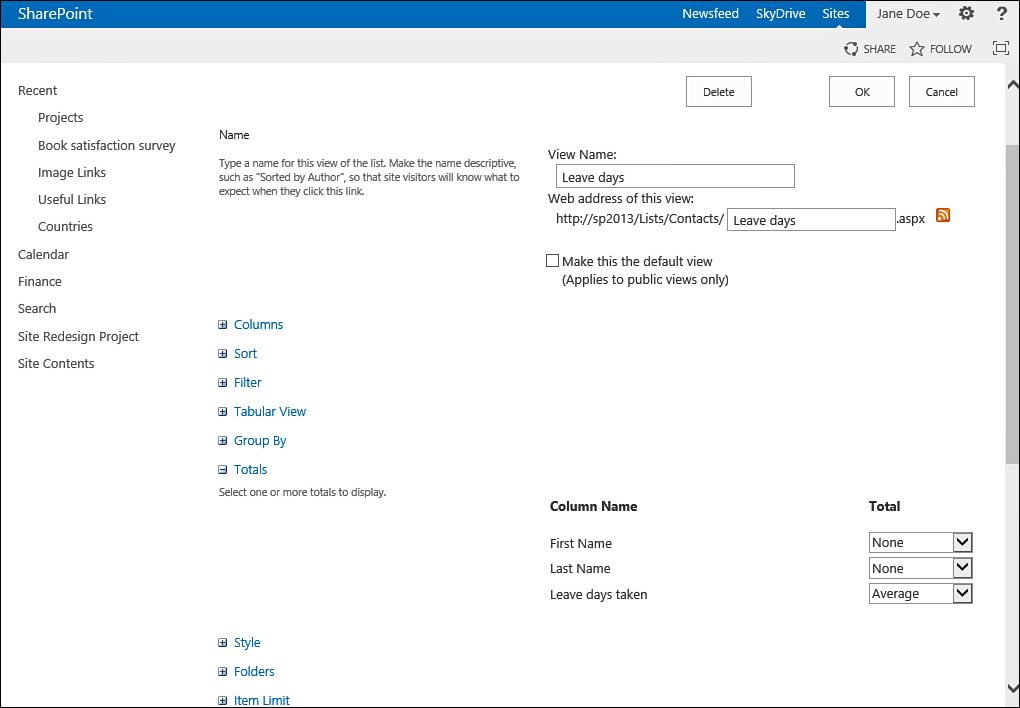
FIGURE 2 Creating a view with an average total on a column.

You can specify only one calculation per column. If you want to do different calculations, you must create a separate view for each calculation.


Tip

You can add a total to a column only if it appears in the view. If the column to which you want to add a total does not show up under the Totals section, you need to make sure it is selected under the Columns section.

 
Others
 
- Sharepoint 2013 : Creating List Views - Specify How Items in a View Are Grouped
- Sharepoint 2013 : Creating List Views - Specify How Items in a View Are Filtered
- PowerShell for SharePoint 2013 : Work Management Service (part 2) - Get the Identity of the Work Management Service Application Proxy,Get a Specific Work Management Service Application Proxy Instance
- PowerShell for SharePoint 2013 : Work Management Service (part 2) - Configure the Search Query Threshold , Configure the User Synchronization Per Server
- PowerShell for SharePoint 2013 : Work Management Service (part 1) - Get a Specific Work Management Service Application Instance , Configure the Refresh Threshold
- Sharepoint 2013 : Creating List Views - Specify How Items in a View Are Sorted
- Sharepoint 2013 : Creating List Views - Specify Columns for a View to Display, Specify the Order of the Columns in a View
- Sharepoint 2013 : Create a Personal or Public View for a List or Library (part 3) - Create a Gantt View
- Sharepoint 2013 : Create a Personal or Public View for a List or Library (part 2) - Create a Calendar View
- Sharepoint 2013 : Create a Personal or Public View for a List or Library (part 1) - Create a Standard View
 
 
Top 10
 
- Microsoft Visio 2013 : Adding Structure to Your Diagrams - Finding containers and lists in Visio (part 2) - Wireframes,Legends
- Microsoft Visio 2013 : Adding Structure to Your Diagrams - Finding containers and lists in Visio (part 1) - Swimlanes
- Microsoft Visio 2013 : Adding Structure to Your Diagrams - Formatting and sizing lists
- Microsoft Visio 2013 : Adding Structure to Your Diagrams - Adding shapes to lists
- Microsoft Visio 2013 : Adding Structure to Your Diagrams - Sizing containers
- Microsoft Access 2010 : Control Properties and Why to Use Them (part 3) - The Other Properties of a Control
- Microsoft Access 2010 : Control Properties and Why to Use Them (part 2) - The Data Properties of a Control
- Microsoft Access 2010 : Control Properties and Why to Use Them (part 1) - The Format Properties of a Control
- Microsoft Access 2010 : Form Properties and Why Should You Use Them - Working with the Properties Window
- Microsoft Visio 2013 : Using the Organization Chart Wizard with new data
Technology FAQ
- Is possible to just to use a wireless router to extend wireless access to wireless access points?
- Ruby - Insert Struct to MySql
- how to find my Symantec pcAnywhere serial number
- About direct X / Open GL issue
- How to determine eclipse version?
- What SAN cert Exchange 2010 for UM, OA?
- How do I populate a SQL Express table from Excel file?
- code for express check out with Paypal.
- Problem with Templated User Control
- ShellExecute SW_HIDE
programming4us programming4us