1. Monitoring Performance with Task Manager
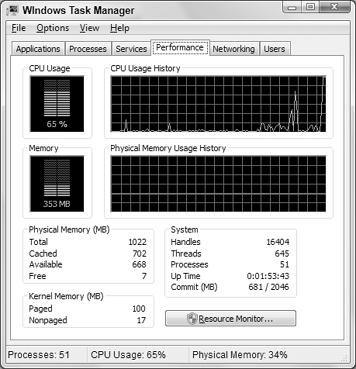
The Performance tab in Task Manager, shown in Figure 1,
provides both graphical and numeric summaries of CPU and memory
resource usage. To watch resource usage, leave Task Manager open and
"always on top" as you run programs and use your computer in the usual
ways. If you have multiple processors, or a multi-core processor, each
may be represented in a separate pane in the CPU history as at the top
of the figure. Choose View => CPU History to decide whether you want to see a single pane or multiple panes.

|
Double-click any chart or a blank area inside the window to show an expanded chart or to restore it to its previous size.
|
|
Here's what all the things you see on the Performance tab represent:
CPU Usage: Indicates how much of the CPU's capacity you're using at the moment.
CPU Usage History: Shows CPU usage over time. Choosing View =>
Show Kernel Times adds a second red line to the chart, which shows the
amount of CPU resources used by kernel operations (core operating system
processes).
System:
The number of handles, threads, and processes running at the time, how
long the system has been up, and amount of memory committed of total
available.
Physical Memory (MB):
The total amount of physical memory in the system, the amount that's
currently available, and the amount used by the System Cache, which maps
to data stored in files. Each measurement is expressed in megabytes.
Kernel Memory (MB): The total paged and nonpaged memory used by the operating system kernel and device drivers.
The Performance charts are useful for identifying major performance bottlenecks.
For example, if the CPU Usage and History charts run high, your CPU is
working very hard. An errant application can consume inordinate amounts
of CPU capacity. Also, reducing the number of running programs will
reduce CPU load.
A common performance bottleneck is limited physical
memory. Running lots of programs with limited memory forces the system
to use lots of virtual memory, which in turn slows down performance
because of the added overhead of swapping pages in and out. Increasing
the amount of virtual memory can help, but the best solution is to add more RAM (physical memory) to the system.
|
Microsoft's published minimum requirement is 1 GB of
RAM for 32-bit Windows 7 and 2 GB for the 64-bit edition, although
Windows 7 will run with less. Naturally, having more than the specified
minimums will provide better performance. With the relatively low cost
of memory today, it's not unreasonable to have from 2 GB to 4 GB of
physical memory. |
2. Networking and Users Tabs
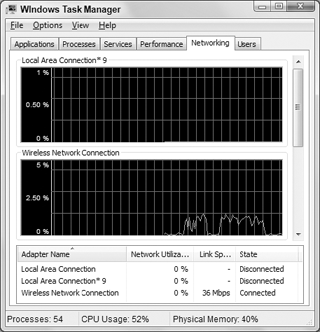
The Networking and Users tabs in Task Manager display
information about your network and user accounts. The Networking tab,
shown in Figure 2,
shows network traffic, or the amount of network bandwidth used. If you
have multiple network interface cards installed on the computer, each is
displayed in its own chart.

The Users tab shows the names of people currently
logged in to the computer. Most users will see only themselves, even if
other users are logged in. If you're an administrator and select Show
Processors from All Users on the Processes tab, the Users tab will show
all current users. Users who are logged in but have used Switch User to
exit their accounts will show as Disconnected.
If people not logging out of their accounts is
causing your system to run slowly, you can send a message to those users
asking them to log off when done using the computer. Click a username
and then click Send Message. Then write a reminder to log out when done.
The users will see the message next time they go into their account.
If you select a user and click Logoff, that user will
be logged off and any unsaved data will be lost. In general, this is a
bad idea, so try to get the user to log off normally before taking this
action.