3. Building Simulated Frequency Distributions
It can be helpful to see how a frequency distribution assumes a particular shape as the number of underlying records increases. Statistical Analysis: Excel 2010 has a variety of worksheets and workbooks for you to download from this book’s website (www.informit.com/title/9780789747204). The following figure, as well as the worksheet
on which it’s based, shows how a frequency distribution comes closer and
closer to the population distribution as the number of sampled records
increases.
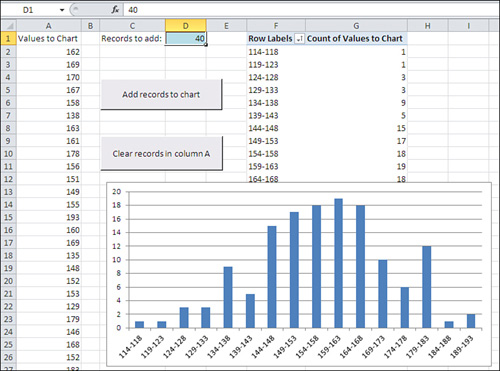
Begin by clicking the button labeled Clear Records in
Column A. All the numbers will be deleted from column A, leaving only
the header value in cell A1. (The pivot table and pivot chart will
remain as they were: It’s a characteristic of pivot tables and pivot
charts that they do not respond immediately to changes in their
underlying data sources.)
Decide how many records you’d like to add, and then enter that number in cell D1. You can always change it to another number.
Click the button labeled Add Records to Chart. When
you do so, several events take place, all driven by Visual Basic
procedures that are stored in the workbook:
A sample is taken from the underlying normal
distribution. The sample has as many records as specified in cell D1.
(The underlying, normally distributed population is stored in a
separate, hidden worksheet named Random Normal Values; you can display
the worksheet by right-clicking a worksheet tab and selecting Unhide
from the shortcut menu.)
The sample of
records is added to column A. If there were no records in column A, the
new sample is written starting in cell A2. If there were already, say,
100 records in column A, the new sample would begin in cell A102.
The pivot table and pivot chart are updated (or, in Excel terms, refreshed).
As you click the Add Records to Chart button repeatedly, more and more
records are used in the chart. The greater the number of records, the
more nearly the chart comes to resemble the underlying normal
distribution.
In effect, this is what happens in an experiment when
you increase the sample size. Larger samples resemble more closely the
population from which you draw them than do smaller samples. That
greater resemblance isn’t limited to the shape of the distribution: It
includes the average value and measures of how the values vary around
the average. Other things being equal, you would prefer a larger sample
to a smaller one because it’s likely to represent the population more
closely.
But this effect creates a cost-benefit problem. It is
usually the case that the larger the sample, the more accurate the
experimental findings—and the more expensive the experiment. Many issues
are involved here (and this book discusses them), but at some point the
incremental accuracy of adding, say, ten more experimental subjects no
longer justifies the incremental expense of adding them. One of the bits
of advice that statistical analysis provides is to tell you when you’re
reaching the point when the returns begin to diminish.