|
You can format an entire table as well as individual cells by using the
commands on the Design and Format contextual tabs, which appear only when a
table is active. For example, you can use buttons on the Design contextual tab
to switch to a different table style, instantly changing the look of the text
and cells to make key information stand out. If you want, you can also format
individual words and individual cells.
In this exercise, you’ll apply a different table style, and then
format a row and individual cells.
Display slide 13, and click
anywhere in the table to activate it.
On the Design contextual
tab, in the Table Style Options
group, clear the Banded Rows check
box.
The banding disappears. All rows except the header row are now the
same color.
In the Table Style Options group,
select the First Column check
box.
The first column is now the same color as the heading, and its text is
white.
Two formatting adjustments have completely changed the
look of the table.

In the Table Styles group, click
the More button.

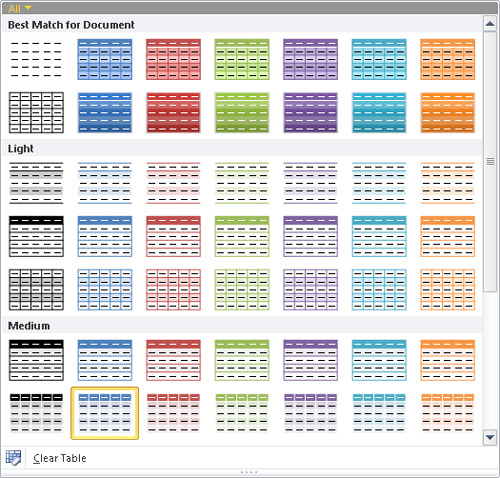
The Table Styles gallery appears.
An orange selection frame around a thumbnail indicates
the applied style.

Drag the bottom border of the gallery upward until you can
see the table.
Point to various styles to preview their effects on the table, and
then under Medium, click the fifth
thumbnail in the second row (Medium Style 2 -
Accent 4).
Drag across the cells containing Winter, Spring,
Summer, and Fall to select them.
On the Design contextual tab, in
the Table Styles group, click the
Shading arrow, and then under
Theme Colors in the palette,
click the green box at the top of the third column (Light Green, Background 2).

Click the cell containing 105,
click the Shading arrow, and then
under Theme Colors in the palette,
click the orange box at the top of the seventh column (Orange, Accent 3).
Click the cell containing 18, click
the Shading arrow, and below the
palette, click More Fill Colors. Then
on the Standard page of the Colors dialog box, click a pale blue color
near the center of the color wheel, and then click OK.
Select Seasonal Temperatures, and
then in the WordArt Styles group,
display the Quick Styles gallery.
Then click the fourth thumbnail in the second row (Fill – Green, Accent 1, Inner Shadow
– Accent 1).
Repeat step 10 to format Minimum,
Average, and Maximum.
On the Layout tab, in the
Table
group, click the Select button, and
then click Select Table.

In the Table Styles group, click
the Borders arrow, and click
Outside Borders.

After experimenting, let’s try a simpler look.
Click anywhere in the table, and display the Table Styles gallery. Then, under Medium, click the third thumbnail in the
second row (Medium Style 2 – Accent
2).
The new table style clears the cell formatting but leaves the text
effects.
A simple approach makes the column and row headings
stand out.

Note:
Save the TemperatureFormatting presentation, and then close it.
|