2. Server-side trace
Using SQL Server Profiler to trace database activity is frequently referred to as client-side tracing,
that is, events are streamed from the server, over the network, to the
Profiler application. Even if the Profiler application is being run on
the SQL Server itself, this is still considered a client-side trace.
One
of the worrisome aspects of client-side tracing with SQL Profiler is
that under certain conditions, events can be dropped, therefore
invalidating event sequencing and performance analysis. Further,
depending on the server load, the overhead of streaming events can
impact server performance, in some cases quite dramatically.
SQL
Server Profiler is a GUI-based client interface to SQL Trace, the
event-tracing service within the database engine. As an alternative to
using SQL Profiler, we can create a server-side trace using a number of
SQL Trace system stored procedures and in doing so avoid both the
performance problems and dropped events commonly associated with
client-side traces.
A
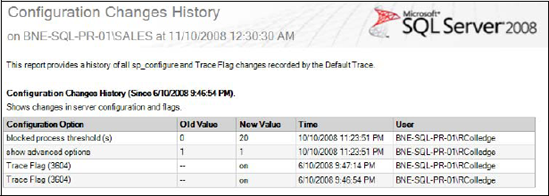
good example of a server-side trace is the SQL Server default trace, a
lightweight, always-on trace recording selected events, primarily
configuration changes. As shown in figure 4,
the Configuration Changes History standard report, accessed by
right-clicking a server instance and choosing Reports, uses this trace
to display the date and time of recent configuration changes. The log
files created by this trace (named log_1.trc, log_2.trc, and so forth)
are stored in the default MSSQL\LOG directory and can be opened in SQL
Profiler for inspection if required.
As
we said earlier, one of the nice things about SQL Profiler is the ease
with which a trace can be created and executed, particularly when
compared to the alternative of creating T-SQL scripts using the SQL
Trace procedures. Fortunately, one of the options available within SQL
Profiler is the ability to script a trace definition, which can then be
used in creating a server-side trace. Creating a trace in this manner,
we get the best of both worlds: using the Profiler GUI to create our
traces, yet running the trace as a server-side trace, thereby avoiding
the performance overhead and dropped events associated with client-side
traces.


A
Profiler trace can be exported to a file using the File > Export
menu item after the trace has been defined with the required events,
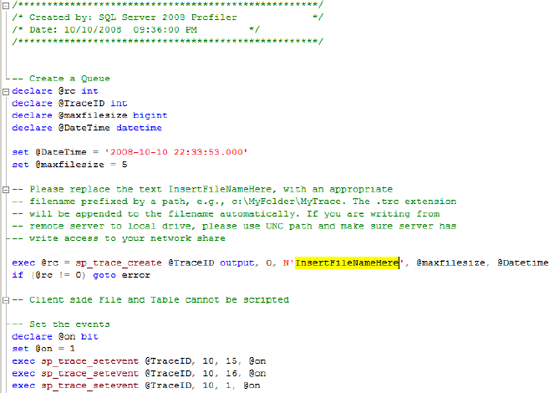
columns, and filters. The resultant T-SQL code, an example of which is
shown in figure 5,
can then be executed against the required instance, which creates the
server-side trace. Once the trace is created, we can use the sp_trace_setstatus and fn_trace_getinfo commands, to control and inspect the trace status.
As per figure 5, we specify the trace file location by editing the sp_trace_create parameters in the script produced by SQL Server Profiler.
One of the important aspects of a server-side trace is that events cannot
be dropped; that is, system throughput may slow if writing the trace
file becomes a bottleneck. While the overhead in writing a server-side
trace file is significantly lower than the Profiler equivalent, it's an
important consideration nonetheless. Therefore the trace file should be
treated in a similar manner to a transaction log file, that is, located
on a dedicated, high-speed disk that's local to the server instance—not
a network file share.
With the
importance of client-side versus server-side traces in mind, let's
continue and look at a number of alternate uses for SQL Server
Profiler, starting with the ability to replay a trace.