Click the Open Resource Monitor link in the Overview Of Performance
Monitor section to access Resource Monitor, or click Start, type
resmon in the Start Search box, and
press Enter.
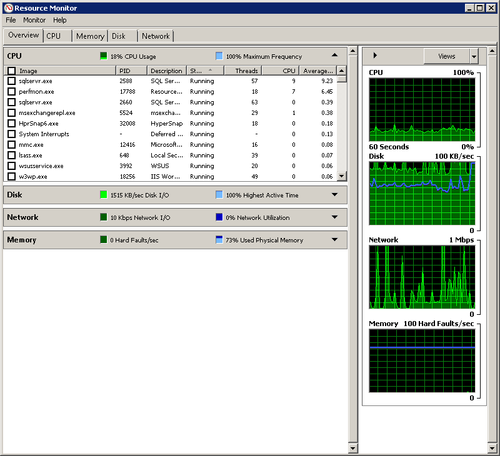
The Resource Monitor page, shown in Figure 1, shows four scrolling graphs for
real-time monitoring of CPU, disk, network, and memory usage.

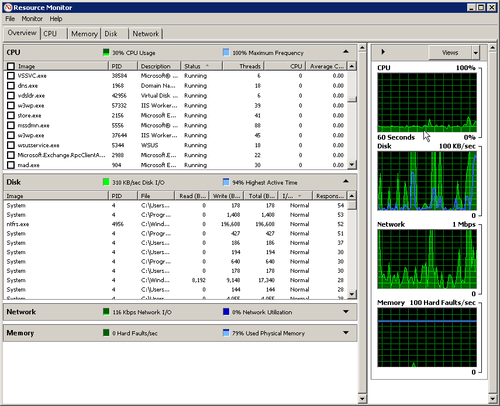
The four sections next to the graphs contain details about each
resource. Click the section to display the detail, as shown in Figure 2.
Note:
Click a row and the highlight will remain on that row, even
when the application’s position changes in the display.

Click the column header in the detail view to sort by ascending
order. Click a second time to sort in descending order.
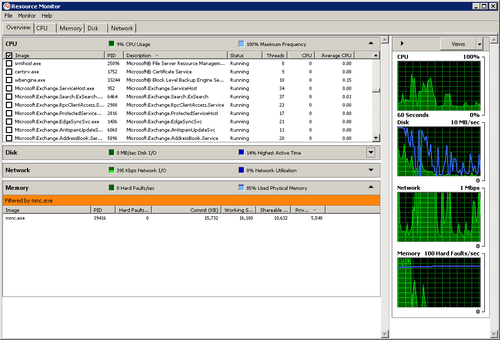
On the CPU tab, you can see check boxes next to the Image
header. Select the images that you are interested in investigating. An
orange bar opens on each section showing what is being filtered, as
shown in Figure 3.
With filtering turned on, Resource Monitor now displays any associated modules or
associated handles.

Clear the check boxes to remove filtering.
The following list defines the headers in each Resource Monitor detail view:
CPU Details
Image The application
using the CPU.
PID The process identification for the application
instance.
Description The name of
the application.
Status Shows if the
process is Running, Suspended, or Terminated. Right-click to
change the status.
Threads The number of
active threads in this instance.
CPU The number of
currently active cycles for this instance.
Average CPU The average
CPU load over the past 60 seconds, expressed as a percentage
of the total capacity of the CPU.
Disk Details
Image The application
using the disk
PID The process
identification for the application instance
File The file being read
or written
Read The speed (in bytes
per second) at which the file was read in the last
minute
Write The speed (in bytes
per second) at which the file was written in the last
minute
Total The average number
of bytes per second read and written to the disk in the last
minute
I/O Priority The priority
of the IO task
Response Time The disk
response time in milliseconds
Network Details
Image The application
using the network resource.
PID The Process ID of the application
instance.
Address The network
address with which the local computer is exchanging
information. This can be an IP address, computer name, or
fully qualified domain name.
Send Amount of data (in
bytes per second) sent in the last minute from the local
computer to the network address.
Receive The amount of
data (in bytes per second) that the application received in
the last minute from the network address.
Total The total bandwidth
(in bytes per second) of the data sent and received in the
last minute.
Memory Details
Image The application
using the memory resource
PID The Process ID of the
application instance
Hard faults/min. The
number of hard faults caused by the application instance in
the last minute
Note:
A hard fault (also called a
page fault) is not an error. It happens
when a page at the address referenced is no longer in
physical memory and has been swapped out or placed on a hard
drive. However, an application that causes a high number of
hard faults will be slow to respond because it constantly
has to read from a hard drive rather than from
memory.
Commit The amount of
virtual memory (in kilobytes) reserved for the process
Working Set (KB) The
amount of memory (in kilobytes) currently used by the
application instance
Shareable (KB) The amount
of the working set memory (in kilobytes) that might be
available for other use
Private (KB) The amount
of the working set memory (in kilobytes) that cannot be
shared
1. Filtering Information from Resource Monitor
Resource Monitor produces a lot
of data, so filtering out the unessential data is necessary if
you’re not to drown in a sea of graphs. To designate filters, start
Resource Monitor and follow these steps:
Select a Resource Monitor tab. In the Image column, select
the check box next to the name of each process you want to
monitor. As you select a process, it’s moved to the top of the
column.
After selecting a process for filtering, the Associated
Handles and Associated Modules tables on the CPU tab will
contain data related to your selection.
Click another tab to view additional resource usage data
for your selection. Tables that contain only filtered results
have an orange information bar below the title bar of the
table.
To stop filtering for a single process or service, clear
its check box. To stop all filtering, clear the check box next
to Image.
Note:
If the process is not using any of the resources displayed
on the current tab, the process name won’t appear in the key
table.
2. Troubleshooting Troublesome Applications
There can be many reasons for an application to appear
nonresponsive—few of them obvious to the naked eye.
Windows Resource Monitor allows you to view a process wait chain and
to end processes that are preventing a program from
functioning properly. In Resource Monitor, the entry for an
unresponsive process appears in red.
Warning:
IMPORTANT Take care when
using Resource Monitor to end a process. If an open program is
dependent on the process, it will immediately close and unsaved
data will be lost. Ending a system process can result in system
instability and also cause data loss.
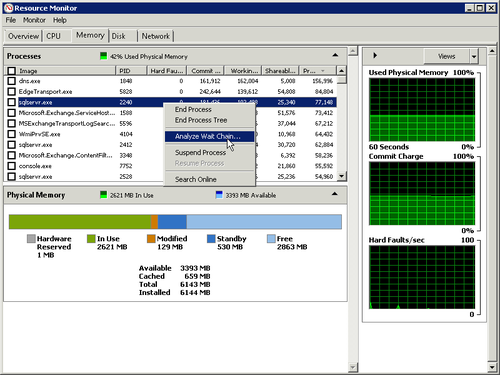
To examine a process, open Resource Monitor and click any tab.
In the Image column, right-click the name of the process you want to
analyze and select Analyze Wait Chain. (See Figure 4.)

If the process is running normally and is not waiting for any
other processes, no wait chain information will be
displayed.
If the process is waiting for another process, a tree
organized by dependency on other processes will be displayed. To end
one or more of the processes in the tree, select the check boxes
next to the process names and click End Process.