When you want to present a lot of data in an organized and easy-to-read
format, a table is often your best choice. On a slide that includes a content
placeholder, you can click the placeholder’s Insert Table button to
start the process of creating a table. On any slide, you can click the Table
button in the Tables group on the Insert tab to add a table outside a
placeholder.
After you specify the number of columns and rows you want in the table,
PowerPoint creates the table structure, which consists of a two-dimensional
organization of rows and columns. The box at the intersection of each row and column is
called a cell. Often
the first row is used for column headings, and the leftmost column is used for
row headings.
You work with PowerPoint tables in much the same way as you work with tables
in Microsoft Word. (If the table you want to use already exists in a Word
document, you can copy and paste that table into a PowerPoint slide, rather than
re-creating it.)
To enter information in the table, you click a cell and then type the data.
You move the cursor from cell to cell by pressing the Tab key. Pressing Tab in
the last cell of the last row inserts a new row at the bottom of the table. If
you need a new row elsewhere, you can insert a row above or below the row
containing the cursor or insert a column to the left or right by clicking the
corresponding buttons in the Rows & Columns group of the Layout
contextual tab. If you no longer need a column or row, you can remove it by
clicking the Delete button in the Rows & Columns group and then clicking
Delete Columns or Delete Rows.
You can click the Merge Cells button in the Merge group of the Layout tab to
combine (merge) selected cells into one cell that spans two or more columns or
rows. Another way to merge cells is by clicking the Eraser button in the Draw
Borders group on the Design contextual tab, and then dragging the eraser that
appears across the border between two cells.
If you want to split a single cell into two or more cells, you can either
select the cell and then click the Split Cells button in the Merge group on the
Layout tab, or you can click the Draw Table button in the Draw Borders group on
the Design tab, and then draw a cell border with the pencil that appears.
Tip:
If you don’t already have a table on a slide, you can click the
Table arrow and then click Draw Table to activate the pencil. You can then
drag cells the size and shape you need to create the table.
In this exercise, you’ll create a table, enter text in its cells,
insert a row, and merge cells.
Display slide 13, which has the
Title And Content layout.
In the content placeholder, click the Insert
Table button.

The Insert Table dialog box opens.
You specify the number of columns and rows in this
dialog box.
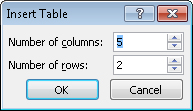
Leave the Number of columns box set
at 5, but change the setting in the
Number of rows box to 3.
Click OK.
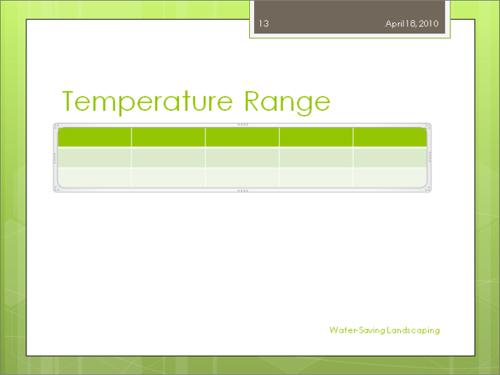
A blank table with five columns and three rows is inserted into the
slide.
By default, the heading row is shaded and the
remaining rows are banded with subtle shades of the same
color.
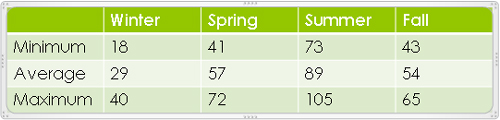
In the first cell of the second column, type Winter, press Tab, type Spring, press Tab, type Summer, press Tab, type Fall, and then press Tab again.
The cursor moves to the first cell of the second row.
Type the following, pressing Tab after each entry:
|
Minimum
|
18
|
41
|
73
|
43
|
|
Average
|
29
|
57
|
89
|
54
|
When you press Tab after the last entry, PowerPoint adds a new row to
the table.
Type the following, pressing Tab after each entry except the
last:
Here are the results.
The banding in the rows below the heading row makes
the information more distinct.
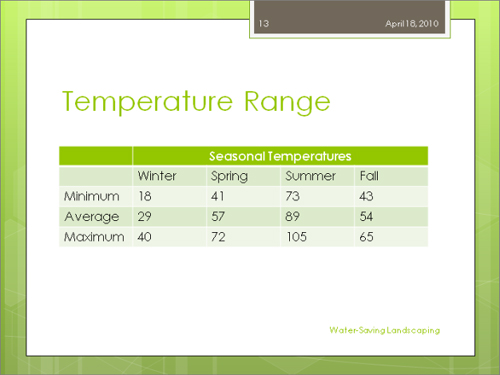
Click anywhere in the heading row, and then on the Layout tab, in the Rows & Columns group, click the Insert Above button.

PowerPoint adds a new row above the headings.
Click the second cell in the new row, hold down the Shift key, and
then press the Right Arrow key three times.
With four cells selected, in the Merge group, click the Merge
Cells button.

In the merged cell, type Seasonal
temperatures.
Without moving the cursor, in the Alignment group, click the Center button.

Note:
Press Ctrl+E to center text.
Point to the frame of the table (don’t point to the sets of
dots, which are sizing handles). Then drag the table downward so that it
sits in about the center of the slide.
Click a blank area of the slide.
The table is no longer active.
You can see the results when you click outside the
table.
Note:
Save the Temperature presentation, and then close it.