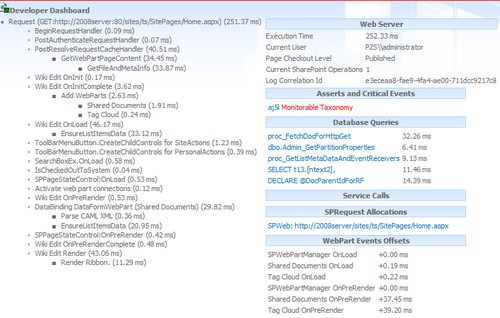
The Developer Dashboard is not just for developers
who write code. It is an important tool in the arsenal of the SharePoint
Administrator.
Tools such as Microsoft's Visual Round Trip Analyzer
are used to determine why a page is performing poorly. The downside of
tools such as this is that they interrogate the page from the outside
and so information such as database queries cannot be seen. We would
have to use another tool such as SQL Profiler to see this information.
The Developer Dashboard brings this functionality
natively to SharePoint 2010. It provides information, such as how a page
is built, how it is performing, what database queries are being run and
for how long, at the bottom of a page in report form. Administrators
can use this information to pinpoint what is happening on a page.
In this recipe, we will enable the Developer
Dashboard and view the report at the bottom of the page. This is done
through PowerShell and can be scripted in the SharePoint
environment.&;
Getting ready
In order to run PowerShell commands, you must be a member of the SharePoint_Shell_Access database role&; on the configuration database. You also must be a member of the WSS_ADMIN_WPG local group&;&;.
How to do it...
On the publishing farm server, select Start | All Programs | Microsoft SharePoint 2010 Products | SharePoint 2010 Management Shell.
In the PowerShell command prompt, type in the following command:
$db = [Microsoft.SharePoint.Administration.SPWebService]::ContentService.DeveloperDashboardSettings;
$db.DisplayLevel = 'On'; $db.RequiredPermissions ='EmptyMask';
$db.TraceEnabled = $true; $db.Update()
Open a team site. You should see a screenshot similar to the following at the bottom of the page:

How it works...
The Developer Dashboard is a farm-wide setting. When
you turn it on, the dashboard appears on page load at the bottom of the
page.
The first line creates a reference to the necessary web service.
The RequiredPermissions parameter&; specifies who can see the Developer Dashboard.
Setting the trace level to true creates a new link called Show or hide additional tracing information...at the bottom of the Developer Dashboard.
There's more...
By default the Developer Dashboard is disabled.
There are three modes that can be set:
When the OnDemand mode is specified, a button appears in the upper right-hand corner of the page as shown here:

When clicked, the Developer Dashboard is shown, and when clicked again, it disappears.
This gives adminstrators the flexibility of enabling the Developer Dashboard without the need to make it visible always.&;
More info
The Developer Dashboard is available only with Windows authentication and is not available with SQL authentication.