3. Message Tracking
With end-user message tracking in the Exchange
Control Panel, Exchange Server 2010 introduces a new wrinkle into what
used to be a purely administrative task. The conscientious
administrator now has three choices for tracking messages:
Allow the end user to search for messages
Track messages via the Exchange Management Console
Track messages via the Exchange Management Shell
These options are listed in order of power and usability, so we'll start with the simplest first: end-user message tracking.
3.1. Self-Service Message Tracking in the Exchange Control Panel
In the past the only way an end user could determine
the delivery status of a message was by requesting delivery receipts,
but there were two drawbacks: many companies would block delivery (and
read) receipts from leaving the Exchange organization, and many users
elected to never send them at all. This left a functionality gap that
the Exchange Control Panel (ECP) helps fill. This new option, available
in Outlook Web App (OWA), allows end users to gather information about
their own messages (or other people's messages if they have the
permissions). This can be incredibly useful for environments with lots
of tech-savvy users, but would require a little investment in training,
documentation, and, above all, communication. For the security
conscious among us, the message-tracking function in the ECP adheres to
the same role-based access control regime as all the other Exchange
components, so users couldn't use this interface to just browse their
way through random users' message history.
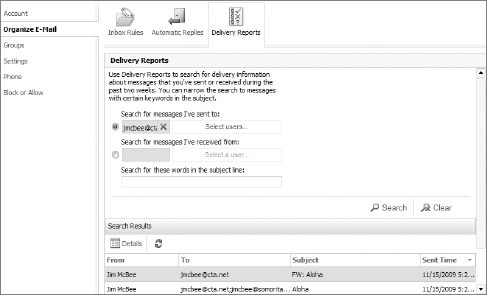
To access the self-service message-tracking
component, simply log into OWA as you normally would, and then select
Options. Select Organize E-Mail and then select Delivery Reports in the
center pane. This displays the message tracking screen shown in Figure 2.
Although the title of the message tracking pane
seems to indicate that it's processing delivery reports, don't worry:
Exchange hasn't been secretly appending delivery reports to every email
your users have been sending! It's simply processing delivery
information taken from the message-tracking logs (remember, message
tracking is enabled by default in Exchange Server 2010).
Assuming the logs are still available, users should
be able to determine information about their own messages although as
in medicine sometimes a little knowledge is a dangerous thing! Users
might become so enamored of self-service message tracking that they
check the status of all their messages, so any small delay could turn
into more help desk calls, not fewer.
You'll need to balance out the needs of the community with the
realistic expectations of delivery performance.
3.2. Message Tracking via the Exchange Management Console
The message tracking tool in the Exchange Management
Console in Exchange Server 2010 is broadly the same as it was in
Exchange Server 2007. Administrators can search for messages from any
sender, to any recipient, with any subject line, using wildcards and
filters as necessary to focus on the critical data.
To launch message tracking from within the EMC,
select the Toolbox in the navigation pane at the left, choose Message
Tracking in the display pane, and then select Open Tool in the Message
Tracking Actions pane at the right. This launches the web-based
message-tracking tool that is the same tool you would use as an end
user but with a few additional options. The big difference is that as
an administrator you will be able to track everyone's messages and not
just your own.
Once you've launched the tool, you'll be presented
with what might be a bewildering array of possibilities. You can track
on any of a number of fields, including recipients, sender, server,
message ID, and subject, as well as date and time. By default, the EventID parameter is prepopulated with Receive,
although you can change this to any valid field via the drop-down
control. If you're tracking a message that was never received, it's
best to deselect this box (as it only pertains to messages that were
actually received).
As you add in parameters, notice that the Get-MessageTrackingLog
cmdlet script is automatically updated to reflect your changes. This
behavior is almost unique within the EMC, and it's extremely useful for
learning the cmdlet's syntax for later use in more complex tracking
operations.
Once you've entered all the relevant criteria, click
Next to begin searching for messages. Depending on your search
criteria, this process could take a significant amount of time.
The Message Tracking Results page is a little
confusing when you first encounter it, but it makes sense after you've
visited it a few times. Because messages pass through different stages
during the mail transfer process, you should (hopefully) see multiple
entries for every message. At a bare minimum, a message should be
listed three times, for the original notification to a Hub Transport
server in the local site (SUBMIT), the delivery to the database on the
receiving Mailbox server (DELIVER), and the ultimate delivery to the
recipient (RECEIVE). If the recipient is in a different site, you'll
see the delivery (SEND) of the message from one Hub Transport to
another, and if there are multiple recipients, you'll probably see a
TRANSFER, which indicates that a message was bifurcated en route.
The message-tracking tool in the console can be
useful, but it's a lot slower than building your own queries with
PowerShell. After you've tracked messages a few times with the EMC,
you'll probably be comfortable enough to forgo the GUI and just use the
shell.
3.3. Message Tracking Using the Exchange Management Shell
Since the message-tracking tool in the EMC uses the Get-MessageTrackingLog cmdlet, there's little to do here but show the actual output of the cmdlet with no input:
Get-MessageTrackingLog | Format-table EventID,Source,Sender,
MessageSubject

EventId           Source            Sender           MessageSubject
-------           ------            ------           --------------
NOTIFYMAPI        STOREDRIVER
SUBMIT            STOREDRIVER       SystemMailbox... Test-Mailflow.
NOTIFYMAPI        STOREDRIVER
SUBMIT            STOREDRIVER       jmcbee@ithico... Aloha
NOTIFYMAPI        STOREDRIVER
SUBMIT            STOREDRIVER       jmcbee@ithico... FW: Aloha
RECEIVE           STOREDRIVER       SystemMailbox... Test-Mailflow.
DELIVER           STOREDRIVER       SystemMailbox... Test-Mailflow.
DSN               DSN               MicrosoftExch... Delivered: Te.
DELIVER           STOREDRIVER       MicrosoftExch... Delivered: Te.
RECEIVE           STOREDRIVER       jmcbee@ithico... Aloha
TRANSFER          ROUTING           jmcbee@ithico... Aloha
RECEIVE           STOREDRIVER       jmcbee@ithico... FW: Aloha
TRANSFER          ROUTING           jmcbee@ithico... FW: Aloha
There's only one "advantage" to using the shell over
the console, and that's the fact that you can specify an unlimited
result set (the GUI is limited to a result set of 1,000 messages).
However, since there aren't many circumstances when you'd need to
process 1,000 messages at a time, this advantage isn't a pronounced
one. But it's the only major difference between the two, so it's still
worth noting in case the need arises.
Now that we've gone through message tracking, you
should be well equipped to determine whether a message was delivered
and if not, where it stalled. If you're still unable to determine
what's happening, there's one more tool we'll cover here that might
help you make sense of what's happening in your environment.