3. Trace replay
Trace replay
refers to the process whereby a captured trace file is replayed against
a database to regenerate the commands as they occurred when the trace
was captured. Such a process is typically used for both debugging and
load generation.
Capturing
a trace that will be used for replay purposes requires particular
events and columns to be included. The easiest way to do this is by
using SQL Profiler's TSQL_Replay template when entering the details in
the Trace Properties window. Selecting this template will ensure all of the necessary events and columns are included for replay.
When
the trace has captured the required events, you can invoke replay by
opening the trace file or table in SQL Profiler and selecting Start
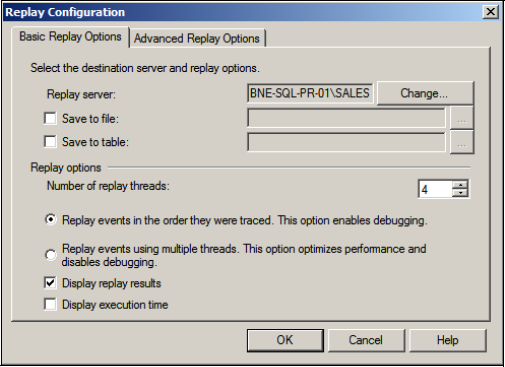
from the Replay menu. The resultant screen, as shown in figure 6, enables various options during replay.
Understanding the replay options is crucial in understanding some of the limitations of using it:
Replay Server
allows the selection of the server instance where the trace file will
be replayed. Notice there is no mention of which database to replay the
trace against. The database with the same name (and database ID) should
exist on the replay instance, which is usually
an instance separate from where the trace was captured. If so, the
replay instance should also include the same logins, passwords, users,
and default databases applicable to the captured trace.
Save to File/Table
enables the results of the replay to be captured to a file or table.
The captured results include the full output of the replayed commands.
For example, a select command that returns 10 rows will result in 10
rows in the trace replay output file/table. The resultant output can be
potentially huge and should therefore be chosen with caution; however,
used correctly, this option is invaluable for debugging purposes.
Number of Replay Threads
enables the degree of concurrency to be set for replay purposes. A high
number of threads will consume more resources but will result in a
faster replay.
Replay Events in the Order They Were Traced will do exactly that and is the option to use when reconstructing an event for debugging purposes.

Replay Events Using Multiple Threads
is the high-performance replay mode that disables debugging. Events are
replayed using multiple threads, with each thread ordering events for a
given SPID; for example, SPID 55 will have its events replayed in the
correct order, but its events may be replayed before SPID 68, even
though SPID 68's events occurred first.
Display Replay Results
shows the results of the replay on screen. The same warnings apply here
as for the Save to File/Table options we covered earlier.
For
the purposes of debugging complex application problems, SQL Profiler's
trace replay is undoubtedly a powerful tool, particularly when
debugging in a live production environment is not an option. In such
cases, a production database backup is typically restored in a testing
environment followed by the replay of a trace captured while the
problem was reproduced in production. Once captured, the trace can be
replayed in a testing environment multiple times, optionally preceded
by a database restore before each replay. Debug options such as Run to
Cursor and Toggle Breakpoint enable classic debugging by replaying the
trace to a certain point, inspecting the output, and then iteratively
moving through the remaining events as required.
Despite
its strengths, there are a number of limitations with trace replay that
you need to understand. The major limitation is its lack of support for traces containing
certain data types and activity; for example, a trace containing
transactional replication, GUID operations, or Bulk Copy Process (BCP)
actions on n/text or image columns cannot be replayed. Further, the
logins and users referenced in the trace must exist on the target
instance with the same permissions, passwords, default database, and
database ID.
Another
common use for replaying trace files is simulating load for change
and/or configuration-testing purposes. Capturing a trace during a peak
load period allows performance to be observed in a test environment
under different configuration settings; however, despite the ability to
increase the number of threads during playback, a trace replay cannot exactly
reproduce the timing and sequencing of events as they occurred during
the capture of the trace. Using the Replay Events in the Order They
Were Traced option will guarantee event sequencing but will not
simulate concurrent activity. Conversely, using Replay Events Using
Multiple Threads will generate simultaneous event replay but at the
expense of event sequencing across all SPIDs.
One
of the things preventing exact event reproduction is the inability to
use multiple replay machines, a limitation addressed in the RML
utilities.