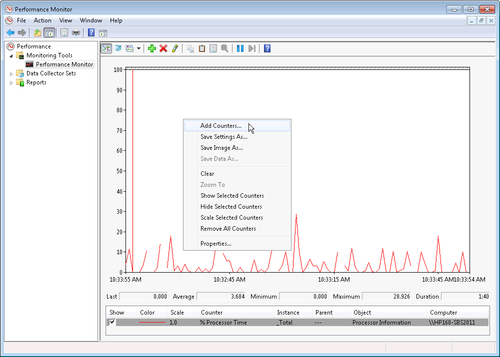
Performance Monitor can help you visualize what is
happening on your network and on individual computers. Like Resource Monitor, it displays events in real time but
can also preserve data in logs for later viewing.
Insufficient memory or processing power can cause bottlenecks
that severely limit performance. Unbalanced network loads and slow
disk-access times can also prevent the network from operating
optimally. Bottlenecks occur when one resource interferes with another
resource’s functioning. For example, if one application monopolizes
the system processor to the exclusion of all other operations, there
is a bottleneck at the processor.
Bottlenecks can occur in Windows subsystems or at any element of
the network, for many reasons, including:
Insufficient resources
A program or client monopolizes a resource
Failure of a program, service, or device
Software incorrectly installed or configured
Incorrect configuration of the system for the
workload
Performance Monitor includes performance counters, event
trace data, and configuration information, which can be viewed
separately and can also be combined into data collector sets.
Performance counters are measurements of system state or
activity. They can be included in the operating system or can be part
of individual applications. Windows Performance Monitor requests the current value of
performance counters at specified time intervals.
Event trace data is gathered from trace providers that are part
of the operating system or of applications that report events.
Information from several trace providers can be collected as a trace
session.
Configuration information is collected from key values in the
Windows registry. Performance Monitor can document the value of a
registry key at a specific time into a log file.
1. Adding Performance Counters
Performance counters will show you the state of an application
or a process in the operating system. You can display any number of
counters on Performance Monitor. Simply right-click inside the
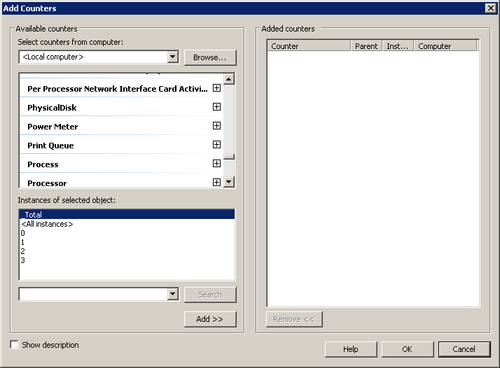
Performance Monitor display and select Add Counters. This opens the
Add Counters dialog box, as shown in Figure 1.

To add a counter to the Performance Monitor, follow these
steps:
Select a computer from the drop-down list, or click Browse
to find other computers.
Available counters are listed below the computer selection
box. You can add all the counters in a group or click the plus
sign to select individual counters.
Note:
Select the Show Description check box in the lower left
of the window for information on what the selected counters
are actually counting.
When you click a group or an individual counter, the
current instances display in the Instances Of Selected Object
window. Select a particular instance or select All Instances. To
search for a particular instance, type the process name in the
drop-down box below the Instances Of Selected Object pane and
click Search. If your search produces no returns, highlight
another group to clear the search. The Search function is
offered only if multiple instances are available.
Click Add to put the counter in the Added Counters list.
Click OK when you’re finished.
2. Changing the Performance Monitor Display
After you add multiple counters, the Performance Monitor
screen can be difficult to decipher. To make the display more
readable, follow these steps:
Right-click the Performance Monitor display and select
Properties to open the Performance Monitor Properties dialog box
as shown in Figure 2.

Click the Data tab to select how you want the counters to
display. Change the color, width, or style of the counter
lines.
Change other display elements on the General, Graph, and
Appearance tabs.
Click the Source tab to change the data source from
Current Activity to a specified log file.
3. Saving the Performance Monitor Display
The current display of Performance Monitor can be saved as an
image or as a web page.
To save the display as an image, follow these steps:
Right-click the Performance Monitor display and select
Save Image As.
Select a location, and type in a name for the saved image.
The image will se saved as a .gif file.
To save the Performance Monitor display as a web page, follow
these steps:
Right-click the Performance Monitor display and select
Save Settings As.
Select a location, and type in a name for the saved
display. The display will be saved as an .html file.