Just as there are three primary ways to measure the
central tendency in a frequency distribution, there’s more than one way
to measure variability.
A third way of measuring variability is the range:
the maximum value in a set minus the minimum value. It’s usually
helpful to know the range of the values in a frequency distribution, if
only to guard against errors in data entry. For example, suppose you
have a list in an Excel worksheet that contains the body temperatures,
measured in Fahrenheit, of 100 men. If the calculated range, the
maximum temperature minus the minimum temperature, is 888 degrees, you
know pretty quickly that someone dropped a decimal point somewhere.
Perhaps you entered 986 instead of 98.6.
The range as a statistic has some attributes that
make it unsuitable for use in much statistical analysis. Nevertheless,
in part because it’s much easier to calculate by hand than other
measures of variability, the range can be useful.
Note
Historically, particularly in the area of
statistical process control (a technique used in the management of
quality in manufacturing), some well known practitioners have preferred
the range as an estimate of variability. They claim, with some
justification, that a statistic such as the standard deviation is
influenced both by the underlying nature of a manufacturing system and
by special events such as human errors that cause a system to go out of
control.
It’s true that the standard deviation takes every
value into account in calculating the overall variability in a set of
numbers. It doesn’t follow, though, that the range is sensitive only to
the occasional problems that require detection and correction.
The use of the range as the sole measure of
variability in a data set has some drawbacks, but it’s a good idea to
calculate it anyway to better understand the nature of your data. For
example, Figure 1 shows a frequency distribution that can be sensibly described in part by using the range.
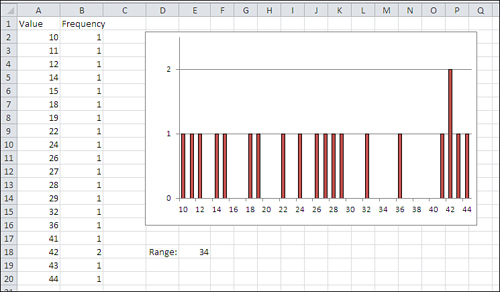
Because an appreciable number of the observations
appear at each end of the distribution, it’s useful to know that the
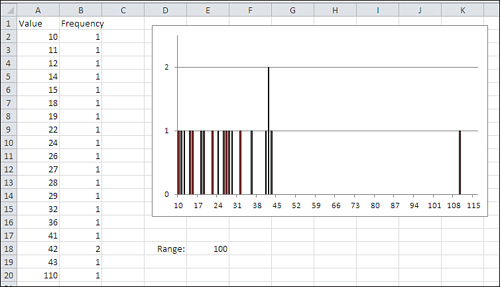
range that the values occupy is 34. Figure 2
presents a different picture. It takes only one extreme value for the
range to present a misleading picture of the degree of variability in a
data set.
The size of the range is entirely dependent on the
values of the largest and the smallest values. The range does not
change until and unless there’s a change in one or both of those
values, the maximum and the minimum. All the other values in the
frequency distribution could change and the range would remain the
same. The other values could be distributed more homogeneously, or they
could bunch up near one or two modes, and the range would still not
change.
Furthermore, the size of the range depends heavily on the number of values in the frequency distribution. See Figure 3
for examples that compare the range with the standard deviation for
samples of various sizes, drawn from a population where the standard
deviation is 15.
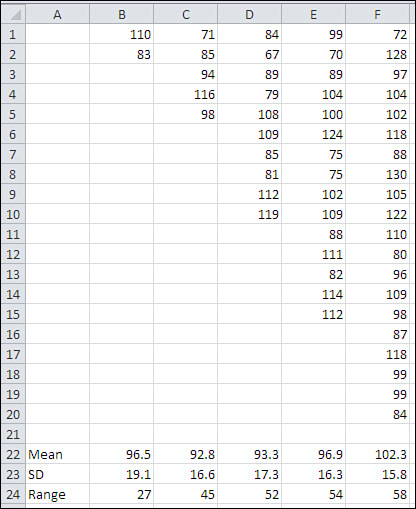
Notice that the mean and the
standard deviation are relatively stable across five sample sizes, but
the range more than doubles from 27 to 58 as the sample size grows from
2 to 20. That’s generally undesirable, particularly when you want to
make inferences about a population on the basis of a sample. You would
not want your estimate of the variability of values in a population to
depend on the size of the sample that you take.
The effect that you see in Figure 3
is due to the fact that the likelihood of obtaining a relatively large
or small value increases as the sample size increases. (This is true
mainly of distributions such as the normal curve that contain many of
their observations near the middle of the range.) Although the sample
size has an effect on the calculated range, its effect on the standard
deviation is much less pronounced because the standard deviation takes
into account all the values in the sample, not just the extremes.
Excel has no RANGE() function. To get the range, you
must use something such as the following, substituting the appropriate
range address for the one shown:
=MAX(A2:A21) − MIN(A2:A21)