The Business template category contains two items for
creating org charts: Organization Chart and the Organization Chart
Wizard. The wizard template presents you with some dialogs that help you
import data and generate an org chart automatically.
Both templates load an add-in
that gives you extra functionality that assists you not only in
generating a chart, but also rearranging, promoting, and deleting
employees. The automatic features are cool, but they force you to use
Visio differently and ignore certain conventions that you’re used to by
now.
Drawing and Editing Org Charts by Hand
Let’s
build a simple org chart and see how the add-in functionality makes
things easier for us. In this exercise, pay particular attention to the
notes about how org chart manipulation differs from typical connected
diagrams.
Creating a Very Basic Org Chart
1. | Start a new Organization Chart drawing. The template is located in the Business template group.
|
2. | Drag
an Executive shape onto the page. The first time you drop an org chart
shape, a small animation plays, showing you how to build an org chart.
For now, nod and smile and click OK.
|
3. | Type two lines of text: Bill Jobs, CEO.
|
4. | View
the Shape Data window for the shape. Org chart shapes have five default
Shape Data fields: Department, Telephone, Name, Title, and E-mail.
Note that even though you typed text only into the Executive shape, its
Name and Title fields magically contain “Bill Jobs” and “CEO.” This is
the org chart add-in at work behind the scenes. It is not normal Visio
behavior to set Shape Data from text typed onto shapes.
|
5. | Change
the values for Name and Title in the Shape Data window. See that the
text in the shape updates? This two-way data entry and display is
special to the org chart solution.
|
6. | Drop
several Manager shapes on top of the Executive shape. Note how they
automatically are connected and aligned below the Executive.
Unlike other Visio diagrams, you don’t need to use the Connector tool or AutoConnect to get your org charts completed.
|
7. | Set the text for each Manager shape. Type something simple like Mgr1, Mgr2, Mgr3.
|
8. | Save the org chart file for use in the next exercise.
|
Creating an org chart is as
simple as dragging and dropping on top of other shapes. And the
synchronization between text and Shape Data fields is also quite handy.
Next, you learn how to lay out subordinates, set chart-wide options, and
where to look to discover more features.
Extending a Very Basic Org Chart
1. | Continue using the org chart you created in the last Let Me Try It.
|
2. | Drop six Position shapes on top of Mgr2. They orient themselves below Mgr2 but are spread out in a very wide formation.
|
3. | You
can change the way Mgr2’s subordinates are arranged. Right-click Mgr2
and choose Arrange Subordinates. The Arrange Subordinates dialog
appears.
The org chart add-in offers special layout functionality, so you don’t
use Visio’s normal layout functionality (Design, Re-layout Page) with
org charts.
You can also rearrange shapes using controls in the Layout and Arrange groups on the Org Chart contextual tab.
|
4. | Click
the first option in the Side-by-side group and then click OK. The six
Position shapes are neatly arranged in two vertical columns below Mgr2.
|
5. | Move
the whole chart. Select the CEO shape and move it. Notice that the
whole organization moves with it. You don’t have to select all the
shapes!
|
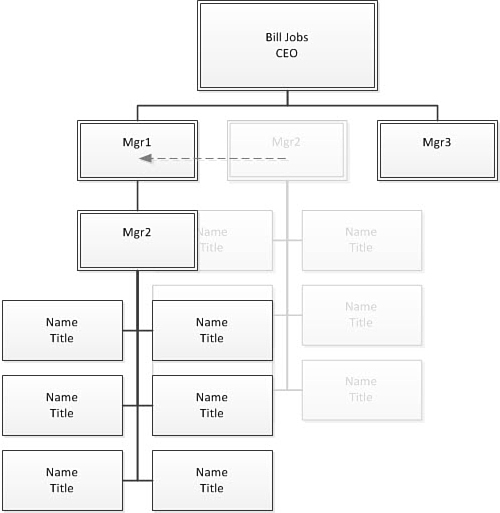
6. | Give
Mgr2 a demotion. Select Mgr2 and drag it on top of Mgr1. Mgr2 becomes a
subordinate of Mgr1, and Mgr2’s subordinates descend the corporate
ladder with their boss, as shown in Figure 1.
|
7. | Click
the Org Chart contextual Ribbon tab. The tab contains a superset of the
options available by right-clicking org chart shapes. The controls are
divided into five groups: Layout, Arrange, Picture, Synchronize, and
Organization Data.
A lot of functionality is available here, and I don’t have space to
cover it all right now. So take some time to explore the options. Be
sure to pause over each control because the ToolTips are very
informative and explain each feature well.
|
8. | Change
the data displayed on all the org chart shapes. Click Display Options
in the Organization Data group on the Org Chart tab. The Options dialog
appears.
|
9. | Click
the Fields tab. Here, you can customize the data displayed in the org
chart shapes. Check Department in addition to Name and Title (which are
already checked) and then click OK. All the org chart shapes now display
Department in their third line. Note: “Department” is the default value
for the Department field. Normally, you would assign real values for
the Department field.
|
Generating Org Charts from Data Using the Wizard
You can also generate an org chart automatically by importing data from a database, text file, or Excel spreadsheet.
About Org Chart Data
The data doesn’t have to
be related to personnel; it can be any hierarchical system. What’s most
important is that each record in the data has a unique ID, and every
record except the top-most person or thing must have a reports-to ID
that is the same as one of the IDs.
Figure 2
shows data that represents the Energy Sources hierarchy. We’ve seen it illustrated with nested
containers, but an org-chart style diagram works just as well.
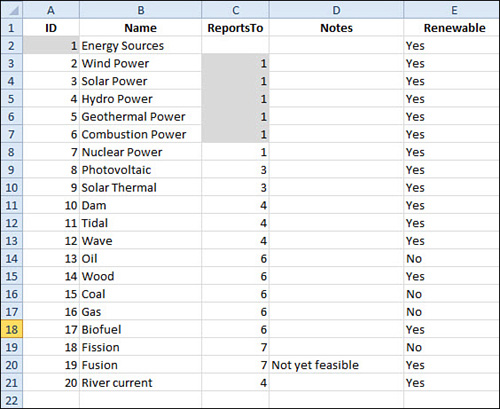
The columns in your
data do not require special names because the Org Chart Wizard enables
you to specify which columns contain the ID and Reports To information.
Also, the wizard enables you
to import extra data, which gets stored in the Shape Data fields of the
position shapes. Looking at the data in Figure 8.13, you can see that it makes a lot of sense to push the data in the Name, Notes, and Renewable columns into your shapes.
Figure 3 shows the result of importing the data in Figure 8.13.
Instead of a nested-container block diagram, the energy sources have
been arranged in org chart fashion. The Notes and Renewable information
has been imported as well; you can see it in the Shape Data window.
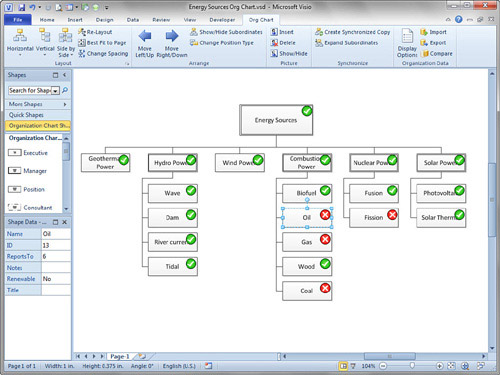
The little circles in Figure 3 are Data Graphics . These make use of the otherwise invisible Shape
Data stored in each shape, and bring a pretty face to the value of the
Renewable field. A check mark shows whether the value is Yes; an X,
whether the value is No.
|
After you’ve run through
the Org Chart Wizard several times, you might start wondering about
automation, especially if you’re generating charts from the same data
source, using the same options, over and over.
Good news! You can
generate org charts automatically “from the command line.” Instead of
running the wizard, you execute a batch file that tells the wizard which
options you want in advance.
|
Limitations of the Org Chart Wizard
Although the Org Chart Wizard has lots of nifty features, it also has a few limitations.
Shapes are placed in
random order when you import data. Alphabetically sorting by employee
name in Excel won’t give you a sensible layout in Visio, unfortunately.
You
can round-trip an org chart: import from data, modify it, export it to a
data file, then re-import it. But fancy customizations like arrangement
styles, colors and other formatting, photos added to position shapes,
and layout order are not preserved. Only the raw data and relationship
information is exported.