Data summarized in a PivotTable is an ideal candidate
for a chart, since the table itself represents an overwhelming amount
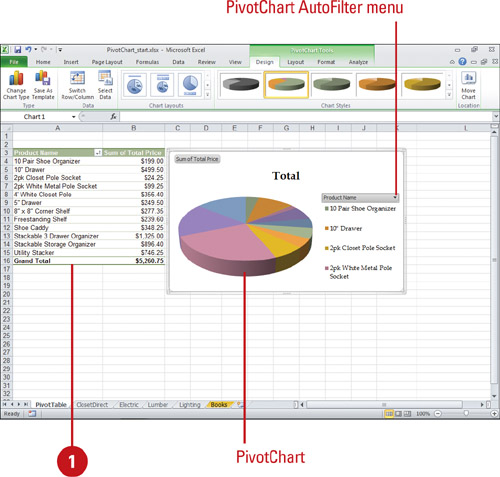
of data. A chart of a PivotTable is called a PivotChart.
Once you select data within the PivotTable, you can chart it like any
other worksheet data using similar tabs under PivotChart Tools. You can
also use the AutoFilter menu to filter data directly in the PivotChart
report (New!), just like in a table. The additional Analyze tab provides options to collapse or expand fields, insert a slicer (New!), refresh or clear data, and show or hide the Field List and different Field Buttons (New!) on a PivotChart.
Create a PivotChart Report from a PivotTable Report
 Click any data field in the PivotTable. Click any data field in the PivotTable.
 Click the Options tab under PivotTable Tools. Click the Options tab under PivotTable Tools.
 Click the PivotChart button. Click the PivotChart button.
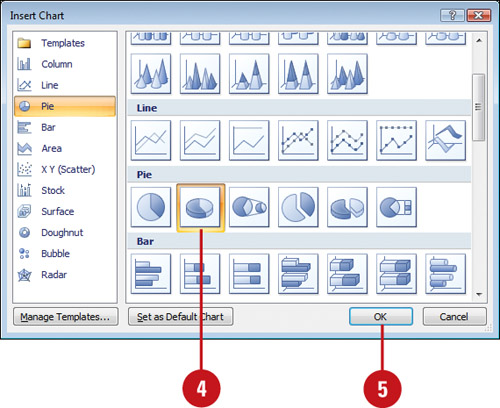
 Click the chart type you want. Click the chart type you want.
 Click OK. Click OK.
The PivotChart appears on the existing worksheet.
You can delete a PivotChart. Click the PivotChart report, and then press Delete.
You can rename a PivotTable or PivotChart.
Click the PivotTable report, click the Options tab, click the
PivotTable Name box, type a new name and then press Enter. Click the
PivotChart report, click the Layout tab, click the PivotChart Name box,
type a new name and then press Enter.
You can rename a field in a PivotTable or PivotChart.
Click the PivotTable report, click the Options tab, click the Active
Field Name box, type a new name and then press Enter. Click the
PivotChart report, click the Analyze tab, click the Active Field Name
box, type a new name and then press Enter.
Modify a PivotChart Report
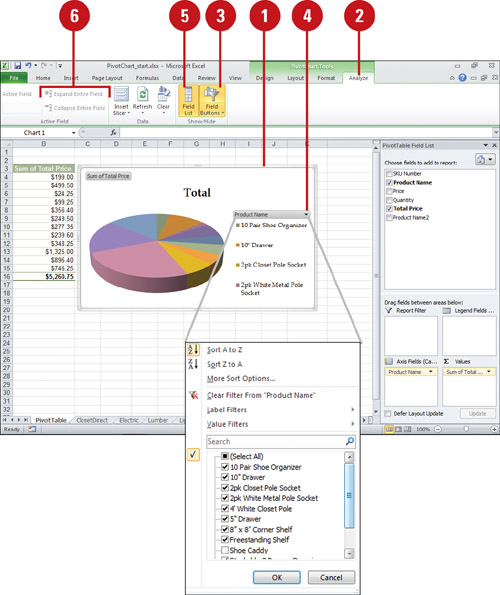
- Click the PivotChart in the worksheet.
- Click the Analyze tab.
- To show or hide field buttons, click the Field Buttons button, and then select an option (Report Filter, Legend, Axis, or Value) to toggle on or off.
- Hide All. Click to hide all field buttons on the PivotChart.
- To filter fields, click the AutoFilter list arrow (name on list arrow varies based on data) on the PivotChart, and then select the filter options you want (New!).
- To show or hide the Field List, click the Field List button.
 To modify the field display, select a field, and then click the Expand Entire Field or Collapse Entire Field button. To modify the field display, select a field, and then click the Expand Entire Field or Collapse Entire Field button.
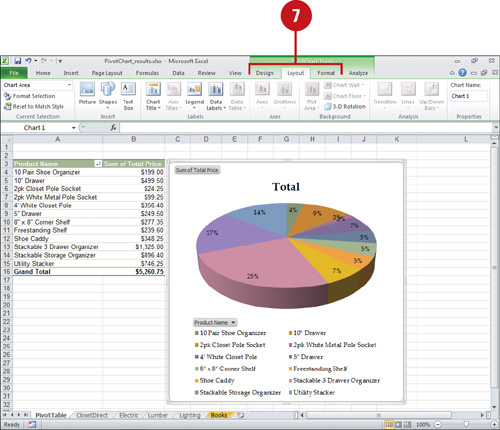
  Use any of the tabs under PivotChart Tools to modify and format the PivotChart report: Use any of the tabs under PivotChart Tools to modify and format the PivotChart report:
- Design. Use to change chart styles, layouts, and type.
- Layout. Use to change chart labels, axes, and background.
- Format. Use to format chart elements using Shape and WordArt styles.
You can refresh PivotTable or PivotChart data.
Click the PivotTable report, click the Options tab, and then click the
Refresh button. Click the PivotChart report, click the Analyze tab, and
then click the Refresh button.
|