Reports in Access are designed to provide a view of
data in a table or query whose initial purpose is to be printed. That
said, beginning with Access 2007, and on into Access 2010 — new views
have been added to reports that take them to the next level and provide
interactivity that was not available in previous versions.
1. How Reports Are Structured
Several different components make
up a report. Perhaps the most important are the various sections and
group levels that are defined in a report.
Sections
are used to display data and other controls such as labels or combo
boxes. The following table describes the types of sections in order.
| SECTION TYPE | DESCRIPTION |
|---|
| Report Header | Typically displays report titles or similar information. Prints once at the top of the report. |
| Page Header | Prints at the top of each page. |
| Group Header | Typically
displays unique data for a group or aggregate data such as a Sum or
Average. Prints at the top of each group level. This section can be
repeated when the data in a group spans multiple pages. (You can have a
maximum of 10 groups in a report.) |
| Detail | Displays records in a report. |
| Group Footer | Displays summary information for a group level. Prints at the bottom of each group level. |
| Page Footer | Prints at the bottom of each page. Often used to display page numbers. |
| Report Footer | Prints once at the end of the report. |
One thing that sets
reports apart from forms is the capability to group data. Grouping
enables you to create aggregates or to view related data in a
hierarchical fashion using group levels. Let's say you are tracking
sessions for a conference and the attendees for each session. Using a
report, you can group by the session as well as the time of the session,
and display the attendees for each session.
Reports also support sort
levels in the hierarchical data. A sort level is the same as a group
level, but without a header or footer section. Data within a group or
across the report is sorted by the specified field. You can create a
maximum of ten group and sort levels in a report. These levels are
stored in GroupLevel objects in the GroupLevel property of the report.
NOTE
The GroupLevel property of the Report
object is not a collection; it's an indexed property. Because it
includes an index parameter, it acts like a collection, but does not
have methods normally associated with collections such as Add, Item, Count, and Remove.
You can add a subreport to a
report. A subreport can show related data in a hierarchy, or you can
use subreports to build dashboard-style reports.
2. New in Access 2007
Before we take a look at some of
the new features related to reports in Access 2010, let's take a look
at some of the features that were changed for reports in Access 2007.
Reports were among the
most improved areas in Access 2007. Several new features have been added
to make reports both easier to create and more powerful. For starters, Layout view
allows you to design reports while you are viewing your actual data.
Many of the tasks of creating a report, such as formatting, sorting and
grouping, and adding totals are handled in Layout view while your data
is onscreen. As a result, you can accomplish many design tasks without
having to switch between Design view and Print Preview. Later on, we'll
take a quick look at improvements that were made to Layout view in
Access 2010.
A report opened in Print
Preview is really just an image, so you cannot easily search for data or
sort or filter content. Access 2007 introduced Report view, which provides a new view of the data in a report that rivals that of forms.
Sorting and grouping is
another area that has been enhanced in Access 2007. The sorting and
grouping dialog box used in previous versions of Access has been
replaced with the new Group, Sort, and Total pane, which enables you to
quickly create group levels and sort levels.
Creating reports has also
been made easier using the Layout view feature. Layouts are groups of
aligned controls that resize and move in conjunction with one another.
Layouts have been greatly improved in Access 2010, so we'll take a
closer look at Layout view in the next section.
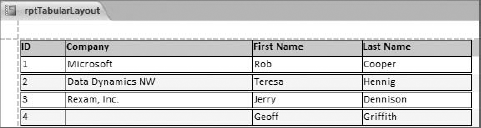
Layouts also enable you to
add gridlines that grow or shrink with the data. These are much easier
than creating lines in previous versions of Access. The Line and
Rectangle controls are still available if you require more control over
the placement of lines. Figure 1 shows a report with a tabular layout that has gridlines.
3. New in Access 2010
Access 2010 adds some additional improvements to features that were added for reports in Access 2007. Let's take a look.
3.1. Enhancements to Layout View
Layout view was first
introduced in Access 2007, and creates a more WYSIWIG approach to
designing forms and reports. Originally, there were two types of layouts
you could create: stacked and tabular. Access 2010 greatly improves the
experience of designing objects in Layout view by removing previous
limitations.
These new improvements are things such as:
Adding controls in Layout view: Previously you could only add text boxes and image controls in Layout view.
Merging and splitting cells: Controls can span multiple rows or columns.
More control over the placement of controls: You can drop a control virtually anywhere within a layout.
Easier to insert and delete rows and columns: New menu commands have been added to simplify these tasks.
Support for new Office themes: You can use themes to apply a consistent style to both forms and reports.
3.2. Web Reports
Much of what is new in Access
2010 can be used to build applications for Access Services, and reports
are no exception. Reports in an Access Services application enable you
to create a report, publish it to an Access Services site, and send the
URL of the report to end users for viewing. This is powerful, but there
are a couple of things you should be aware of.
First and foremost, unlike
forms, reports do not support events or macros for custom logic in the
report. This means there is no programmability for reports in Access
Services. When you create a web report in Access 2010, no events will be
listed in the property sheet for the report or controls on the report
for this reason.
Second, reports only support a
few types of controls. The supported controls are text box, check box,
label, and hyperlink. Combo boxes and list boxes are not supported,
which means that if you want to use a lookup field to display data on a
report, you will need to modify the query to include the lookup table to
display values on the report.
3.3. SubReports in Forms
For quite some time, we've
been able to view subforms in reports, but not the other way around.
Reports have never been able to be viewed as a subform on a form — that
is, until now. Using Access 2010, you can set the SourceObject
property of a subform control on a form to the name of a report. This
was largely done to enhance the new navigation control in Access 2010,
but you can use your own reports in subform controls without a
navigation control as well.
You can also add reports to a subform control in an Access Services application.
3.4. Detecting Whether a SubReport Is Opened in a Form or Report
Once you've started to use subreports in your subforms, it might be
necessary to determine whether a report is open in a subform. To
determine this, the Subform object in the object model now includes a Report property. The following code shows how to determine whether a report is open in a subform control.
Private Function IsSubreport(objSubform As SubForm) As Boolean
    On Error Resume Next
    IsSubreport = (Not objSubform.Report Is Nothing) And (Err = 0)
    On Error GoTo 0
End Function
Now that reports can be
hosted in a subform control in Access 2010, it may also be necessary to
determine whether the object in the subform control is actually a
subform. The following code shows how to do this:
Private Function IsSubform(objSubform As SubForm) As Boolean
    On Error Resume Next
    IsSubform = (Not objSubform.Form Is Nothing) And (Err = 0)
    On Error GoTo 0
End Function
Both of these functions work
by testing the object inside the subform control. In the case of a
subreport, we're testing the new Report property of the Subform object. In the case of a subform, we're testing the Form property. Also notice that both functions include inline error handling. This is because Access throws a runtime error if the Form or Report properties of the Subform object are invalid.
The following sample code shows how to use these functions:
Private Sub cmdTest_Click()
    If (IsSubform(Me.NavigationSubform)) Then
        MsgBox "The name of the subform is: " & Me.NavigationSubform.Form.Name
    Else
        MsgBox "The specified subform control does not contain a subform."
    End If

    If (IsSubreport(Me.NavigationSubform)) Then
        MsgBox "The name of the subreport is: " & Me.NavigationSubform.Report.Name
    Else
        MsgBox "The specified subform control does not contain a subreport."
    End If
End Sub
3.5. Improved Conditional Formatting
Conditional formatting for
controls in Access 2007 and previous versions allowed up to three
defined conditions and the default condition. With conditional
formatting in Access 2010, you can now have up to fifty conditions
defined for a text box or combo box.
Having the opportunity to
add more conditions may eliminate the need for complex logic in code.
This is a big win, but it doesn't stop there. In addition to being able
to add more than three conditions, there are also new options available
for conditional formatting in Access 2010.
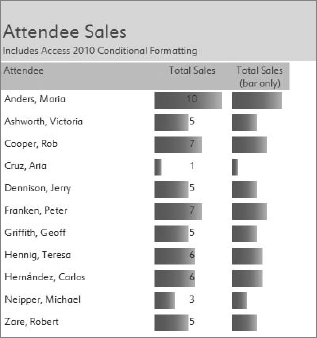
If you've used conditional
formatting in Excel 2007 or Excel 2010, you may be familiar with data
bars. Data bars are a way to apply formatting to a control based on the
entire data set. For example, let's say that you have a report that
shows number of sales for the month. You could apply data bar formatting
to show the person with the highest figures. This type of visualization
can make reports easy to understand and very interesting. Figure 2
shows data bars on a report in Access 2010. The first data bar includes
the text in the control, and the second omits the text and only
displays the data bar.